Notably in the first section of the base results, specifically with plotted lines comparing randomly generated and existing.
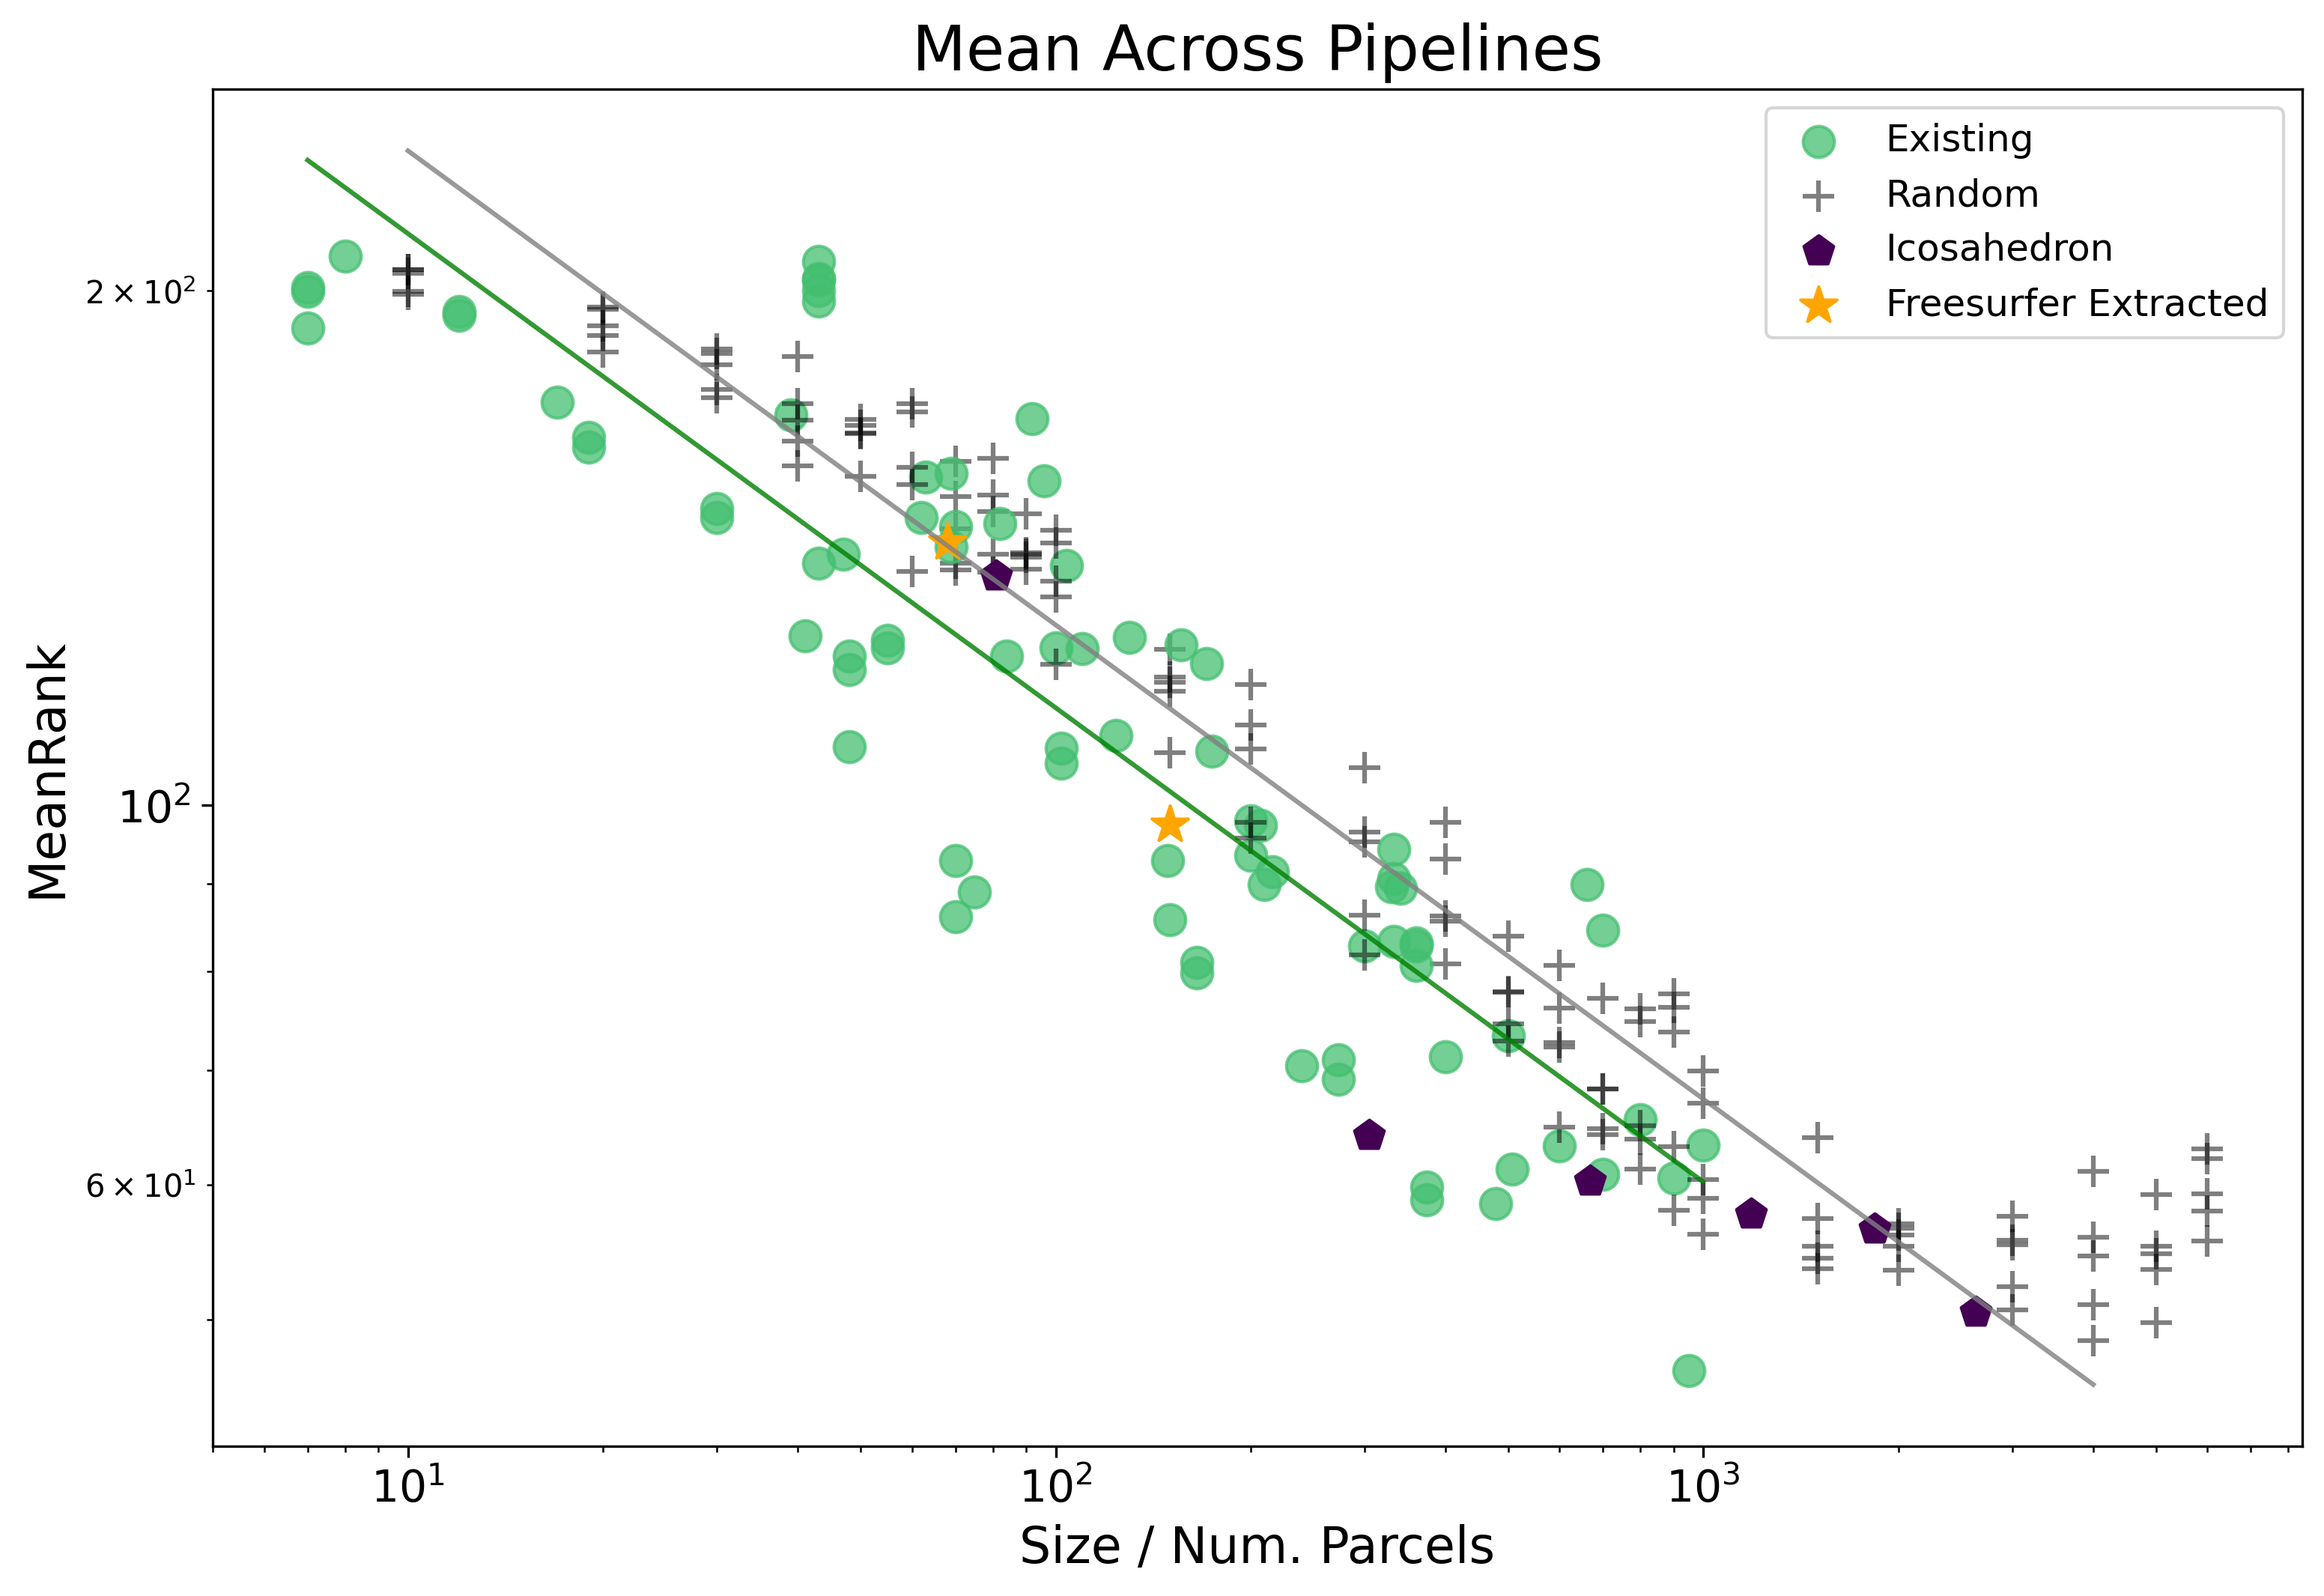
A follow up question one might have after looking at this plot is: Is there any potential problem with randomly generated parcellations extending out beyond sizes 1000 whereas the existing based parcellations do not? The best way to answer this question is to compare the fits from the original results to fits on a set of truncated results considering parcellations of size only up to 1000.
First the base results:
| Dep. Variable: | Mean_Rank | R-squared: | 0.901 |
|---|---|---|---|
| Model: | OLS | Adj. R-squared: | 0.899 |
| Method: | Least Squares | F-statistic: | 459.6 |
| Date: | Tue, 11 Jan 2022 | Prob (F-statistic): | 6.68e-100 |
| coef | std err | t | P>|t| | [0.025 | 0.975] | |
|---|---|---|---|---|---|---|
| Intercept | 2.6119 | 0.015 | 171.406 | 0.000 | 2.582 | 2.642 |
| C(Parcellation_Type)[T.Freesurfer Extracted] | 0.0154 | 0.042 | 0.367 | 0.714 | -0.067 | 0.098 |
| C(Parcellation_Type)[T.Icosahedron] | -0.0040 | 0.025 | -0.159 | 0.874 | -0.054 | 0.046 |
| C(Parcellation_Type)[T.Random] | 0.0485 | 0.009 | 5.597 | 0.000 | 0.031 | 0.066 |
| Size | -0.2774 | 0.007 | -41.980 | 0.000 | -0.290 | -0.264 |
Truncated to 1000 results:
| Dep. Variable: | Mean_Rank | R-squared: | 0.875 |
|---|---|---|---|
| Model: | OLS | Adj. R-squared: | 0.873 |
| Method: | Least Squares | F-statistic: | 316.0 |
| Date: | Mon, 03 Jan 2022 | Prob (F-statistic): | 3.29e-80 |
| coef | std err | t | P>|t| | [0.025 | 0.975] | |
|---|---|---|---|---|---|---|
| Intercept | 2.6288 | 0.018 | 144.702 | 0.000 | 2.593 | 2.665 |
| C(Parcellation_Type)[T.Freesurfer Extracted] | 0.0148 | 0.043 | 0.343 | 0.732 | -0.070 | 0.100 |
| C(Parcellation_Type)[T.Icosahedron] | -0.0347 | 0.035 | -0.980 | 0.328 | -0.105 | 0.035 |
| C(Parcellation_Type)[T.Random] | 0.0469 | 0.009 | 5.185 | 0.000 | 0.029 | 0.065 |
| Size | -0.2855 | 0.008 | -35.225 | 0.000 | -0.302 | -0.270 |
The conclusion after a bit of squinting is pretty clear, there is no real difference, the fits stay quite simmilar.