Extra Results by Parcellation Type
As an alternative modelling choice to the results explored in base results we could instead of using
formula log10(Mean_Rank) ~ log10(Size) + C(Parcellation_Type), instead use either log10(Median_Rank) ~ log10(Size) + C(Parcellation_Type),
log10(Max_Rank) ~ log10(Size) + C(Parcellation_Type) or log10(Min_Rank) ~ log10(Size) + C(Parcellation_Type). The key variable changing here being
the use of median, max or min to summarize ranks, instead of mean rank. Importantly, in this case, the mean or average is still used to summarize across Pipelines, and as in
the base comparison we still estimate the region where a powerlaw holds and only model the results within this range, but with the
alternate formulation of averaged rank.
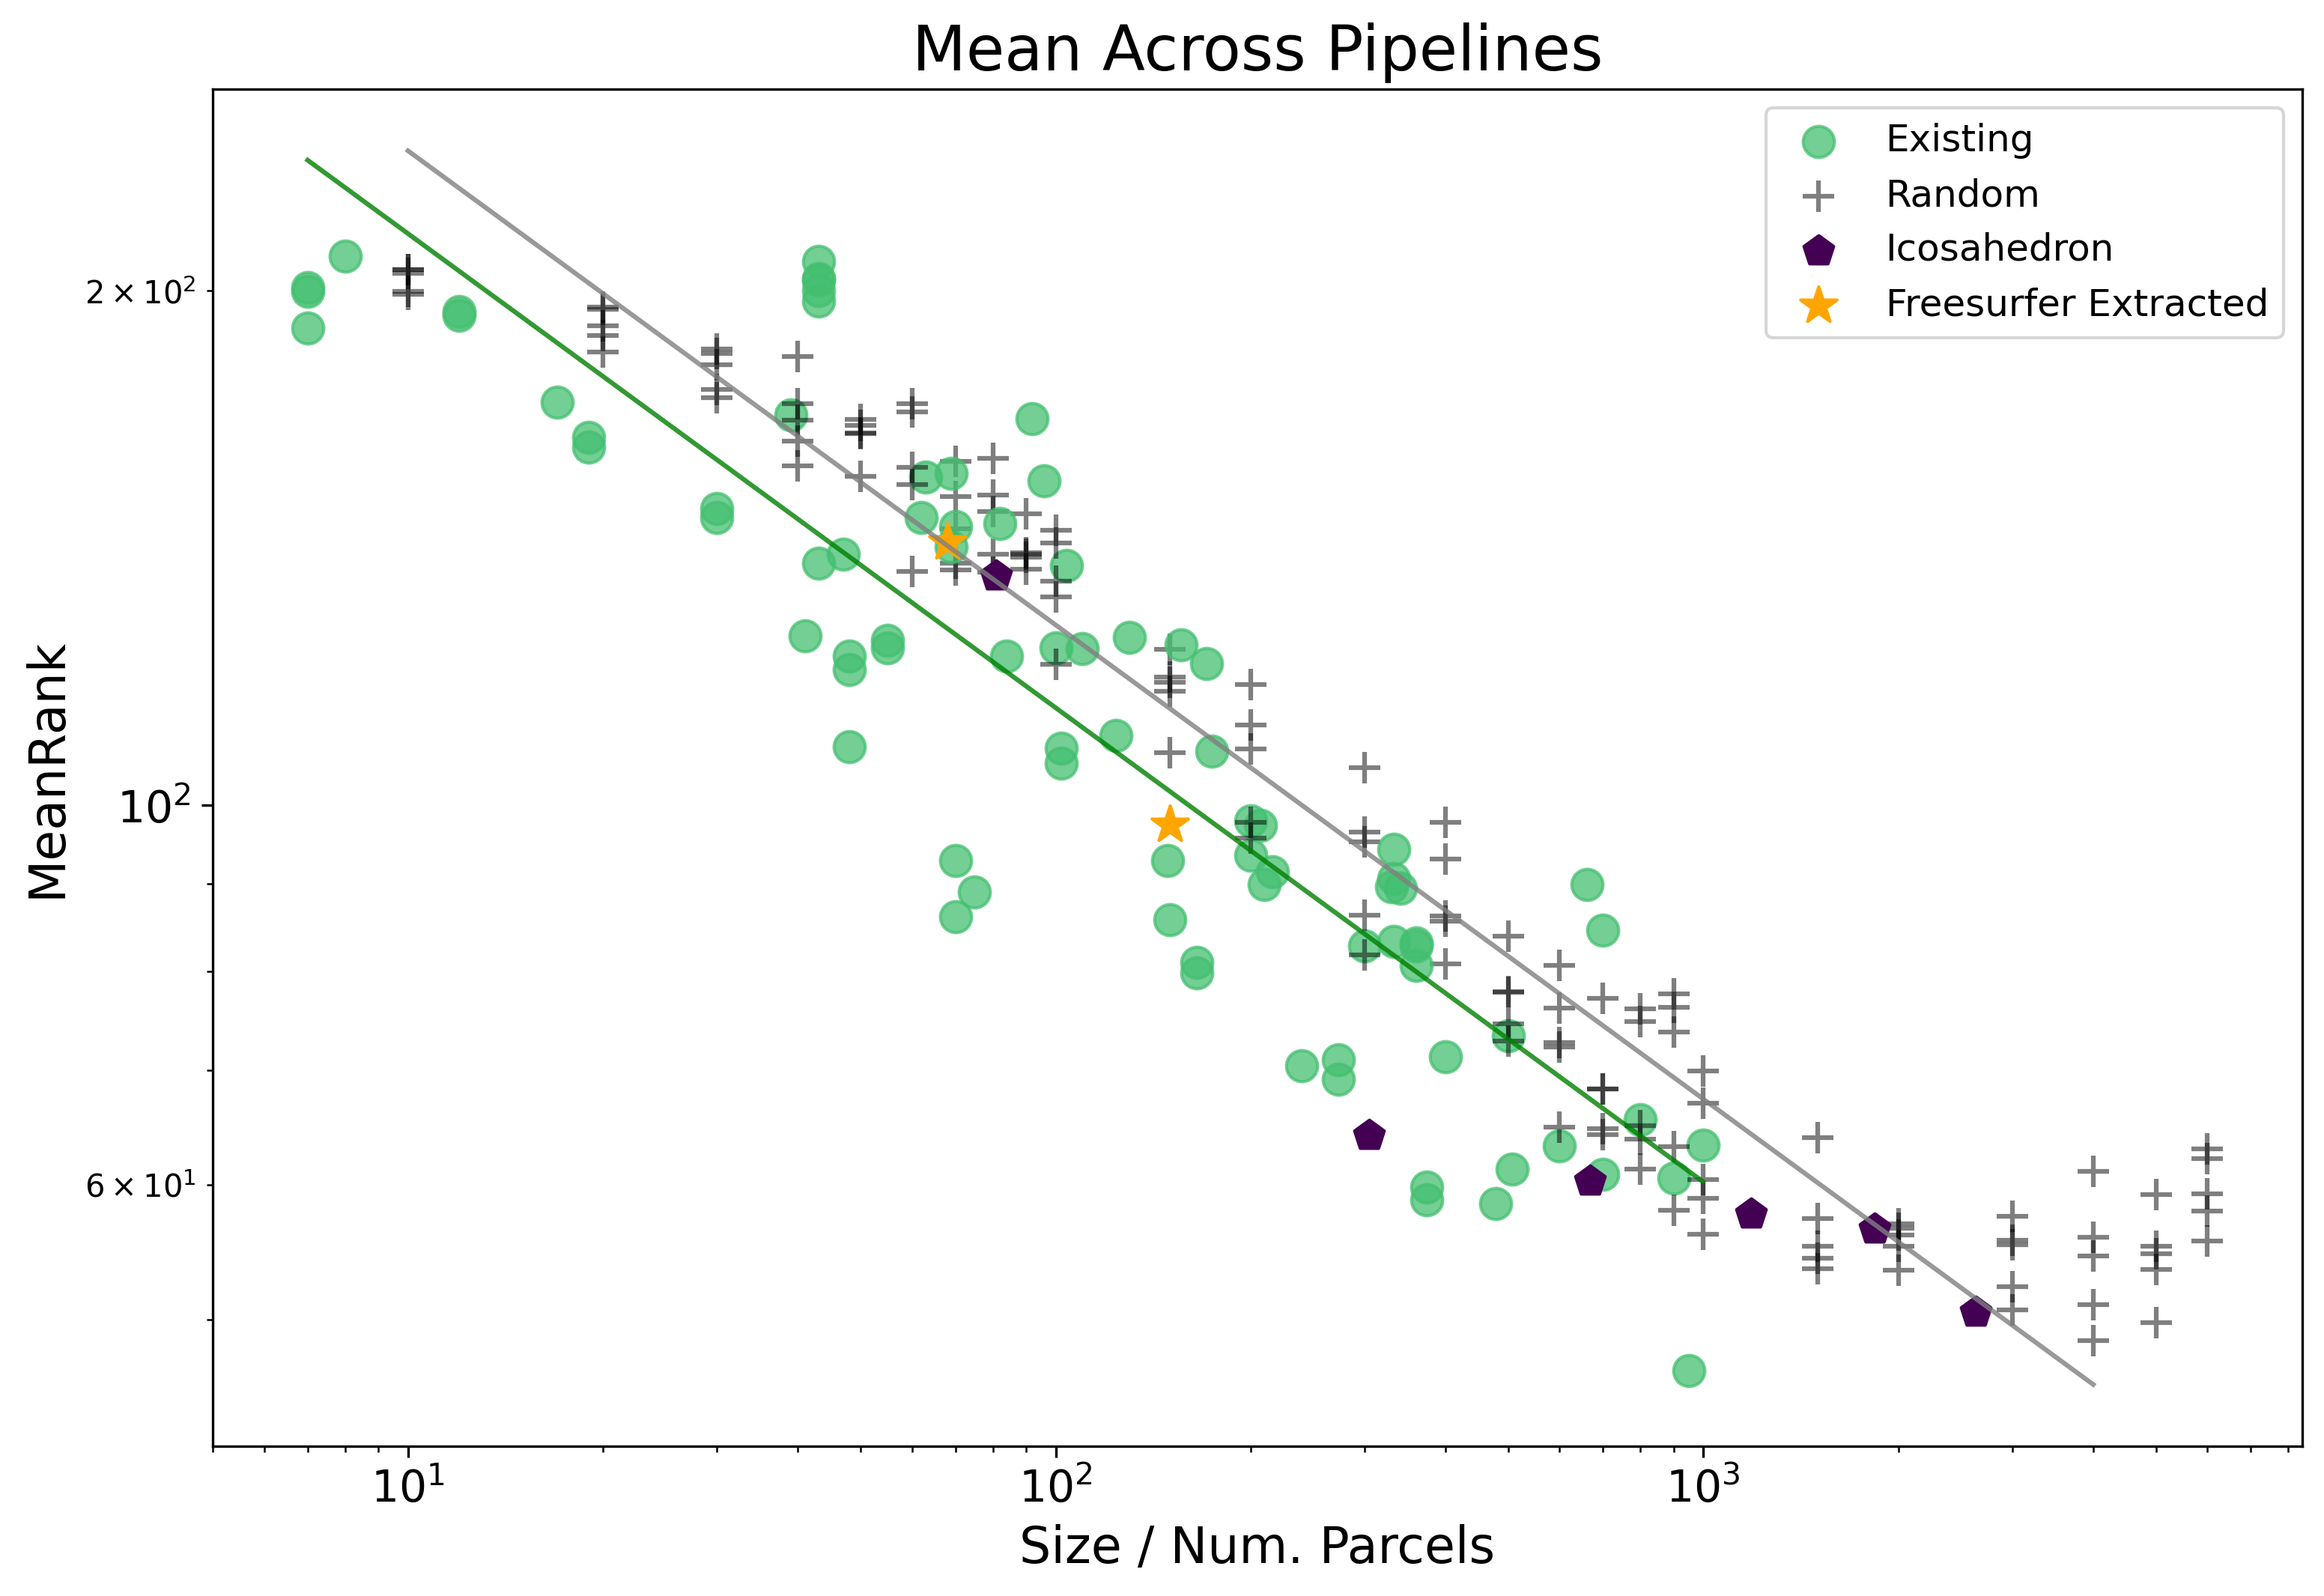
Mean Rank
For ease of comparison we again provide the results from the Mean Rankings here.
| Dep. Variable: | Mean_Rank | R-squared: | 0.901 |
|---|---|---|---|
| Model: | OLS | Adj. R-squared: | 0.899 |
| Method: | Least Squares | F-statistic: | 459.6 |
| Date: | Tue, 11 Jan 2022 | Prob (F-statistic): | 6.68e-100 |
| coef | std err | t | P>|t| | [0.025 | 0.975] | |
|---|---|---|---|---|---|---|
| Intercept | 2.6119 | 0.015 | 171.406 | 0.000 | 2.582 | 2.642 |
| C(Parcellation_Type)[T.Freesurfer Extracted] | 0.0154 | 0.042 | 0.367 | 0.714 | -0.067 | 0.098 |
| C(Parcellation_Type)[T.Icosahedron] | -0.0040 | 0.025 | -0.159 | 0.874 | -0.054 | 0.046 |
| C(Parcellation_Type)[T.Random] | 0.0485 | 0.009 | 5.597 | 0.000 | 0.031 | 0.066 |
| Size | -0.2774 | 0.007 | -41.980 | 0.000 | -0.290 | -0.264 |
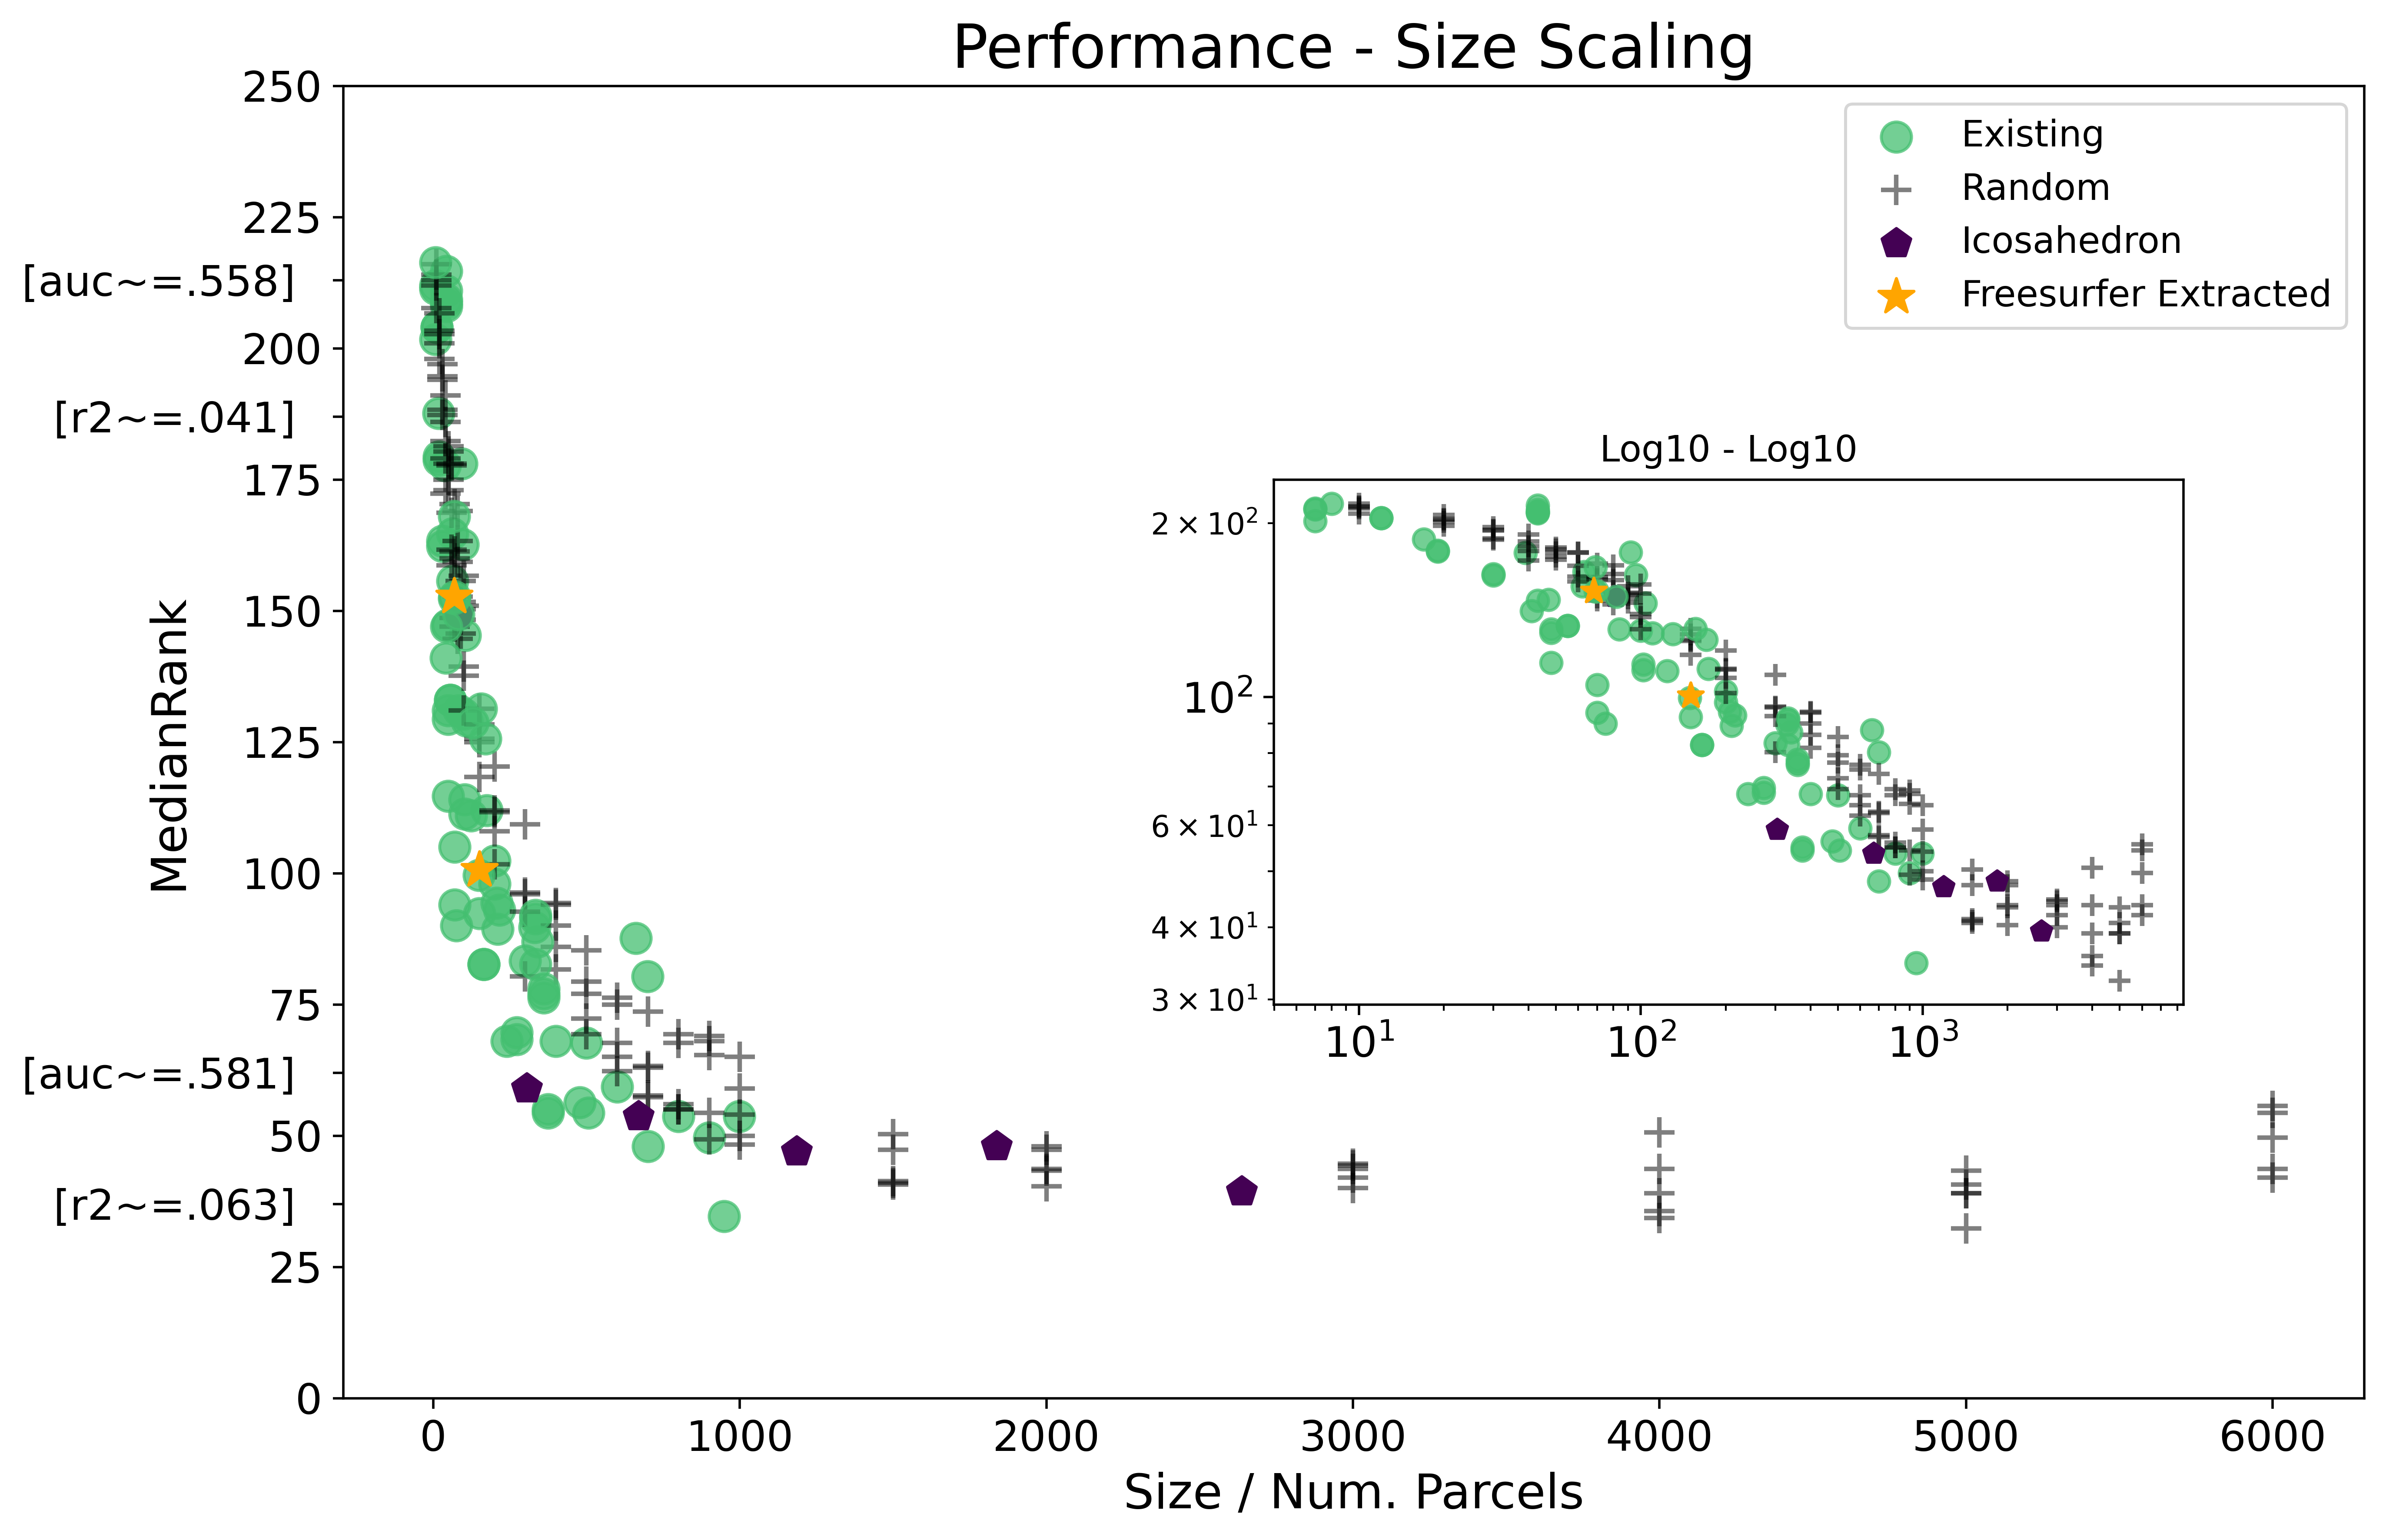
Median Rank
| Dep. Variable: | Median_Rank | R-squared: | 0.917 |
|---|---|---|---|
| Model: | OLS | Adj. R-squared: | 0.916 |
| Method: | Least Squares | F-statistic: | 561.6 |
| Date: | Tue, 11 Jan 2022 | Prob (F-statistic): | 3.42e-108 |
| coef | std err | t | P>|t| | [0.025 | 0.975] | |
|---|---|---|---|---|---|---|
| Intercept | 2.7548 | 0.017 | 159.032 | 0.000 | 2.721 | 2.789 |
| C(Parcellation_Type)[T.Freesurfer Extracted] | 0.0244 | 0.047 | 0.515 | 0.607 | -0.069 | 0.118 |
| C(Parcellation_Type)[T.Icosahedron] | -0.0160 | 0.029 | -0.562 | 0.575 | -0.072 | 0.040 |
| C(Parcellation_Type)[T.Random] | 0.0487 | 0.010 | 4.947 | 0.000 | 0.029 | 0.068 |
| Size | -0.3422 | 0.007 | -46.304 | 0.000 | -0.357 | -0.328 |
As with mean rank, we have only the significant coef. between existing and random parcellations - we plot below just these two lines of fit, as estimated by the OLS, and colored by parcellation type.
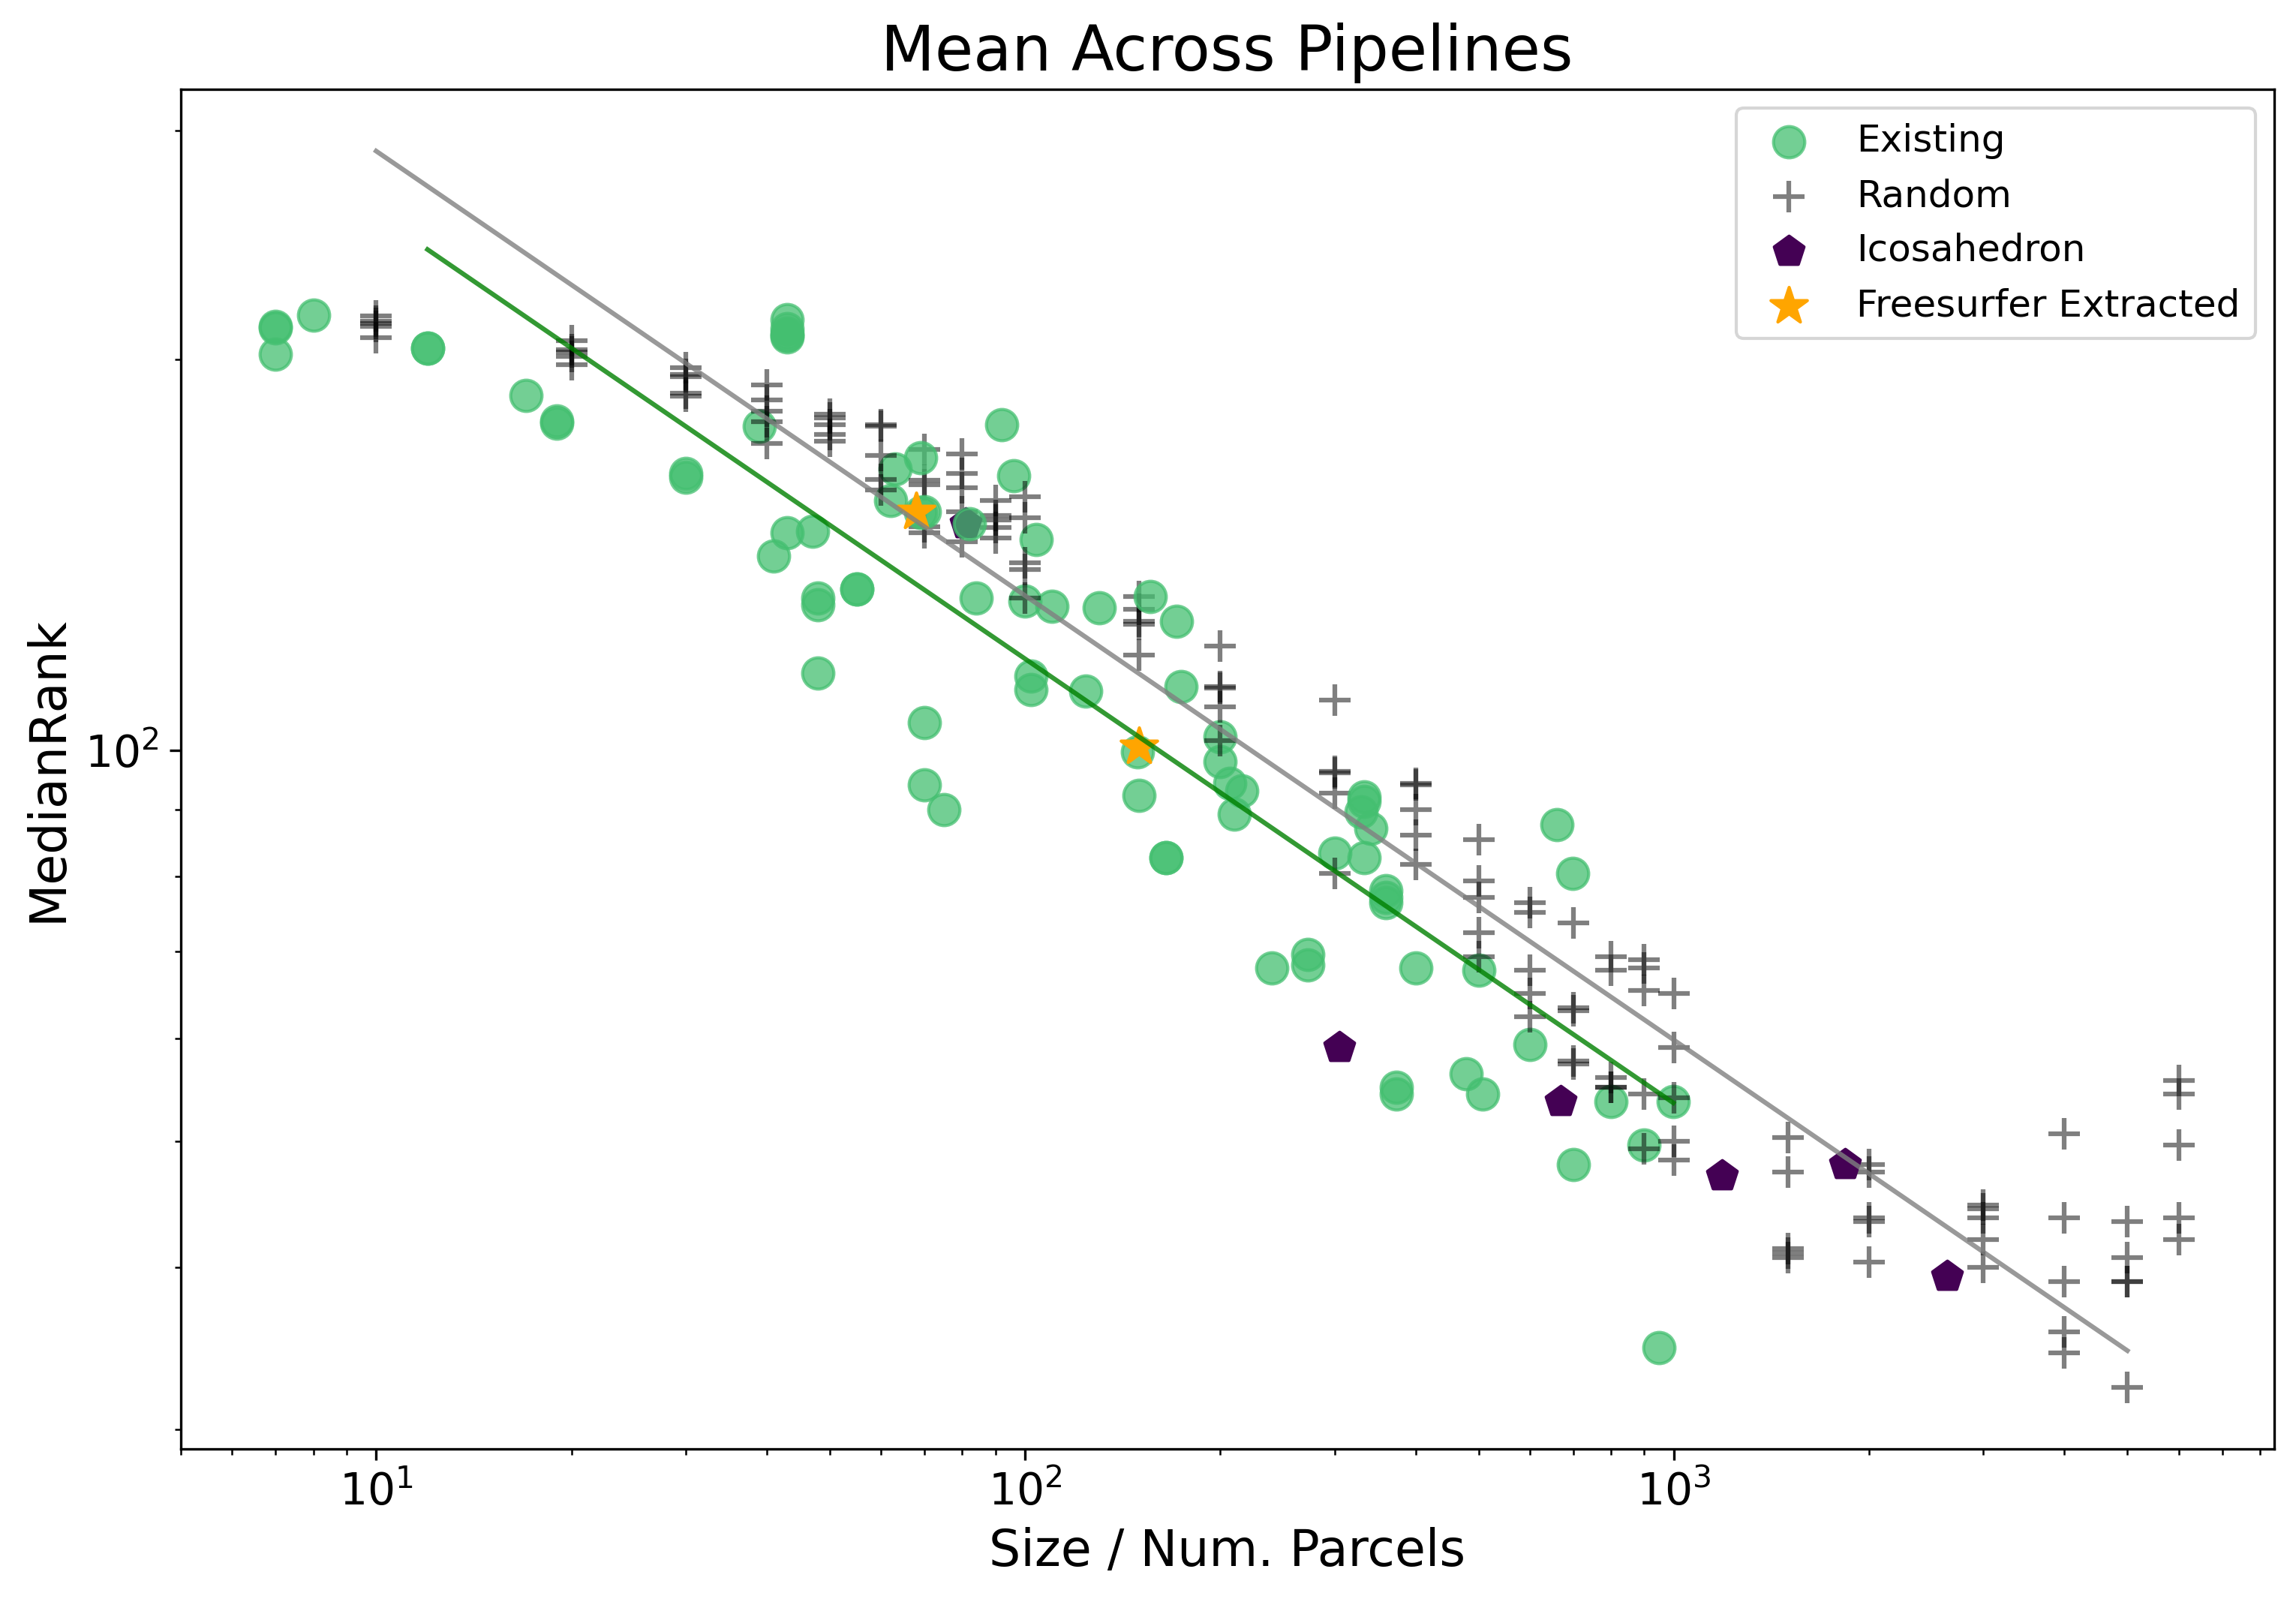
As might be expected, the difference between mean and median ranks ends up being pretty small. Interesting, we actually end up with a more robust power-law scaling fit when using median, as well as a larger size range in which the relationship holds.
A recreation of the main figure from the index page, but with median rank is provided here:
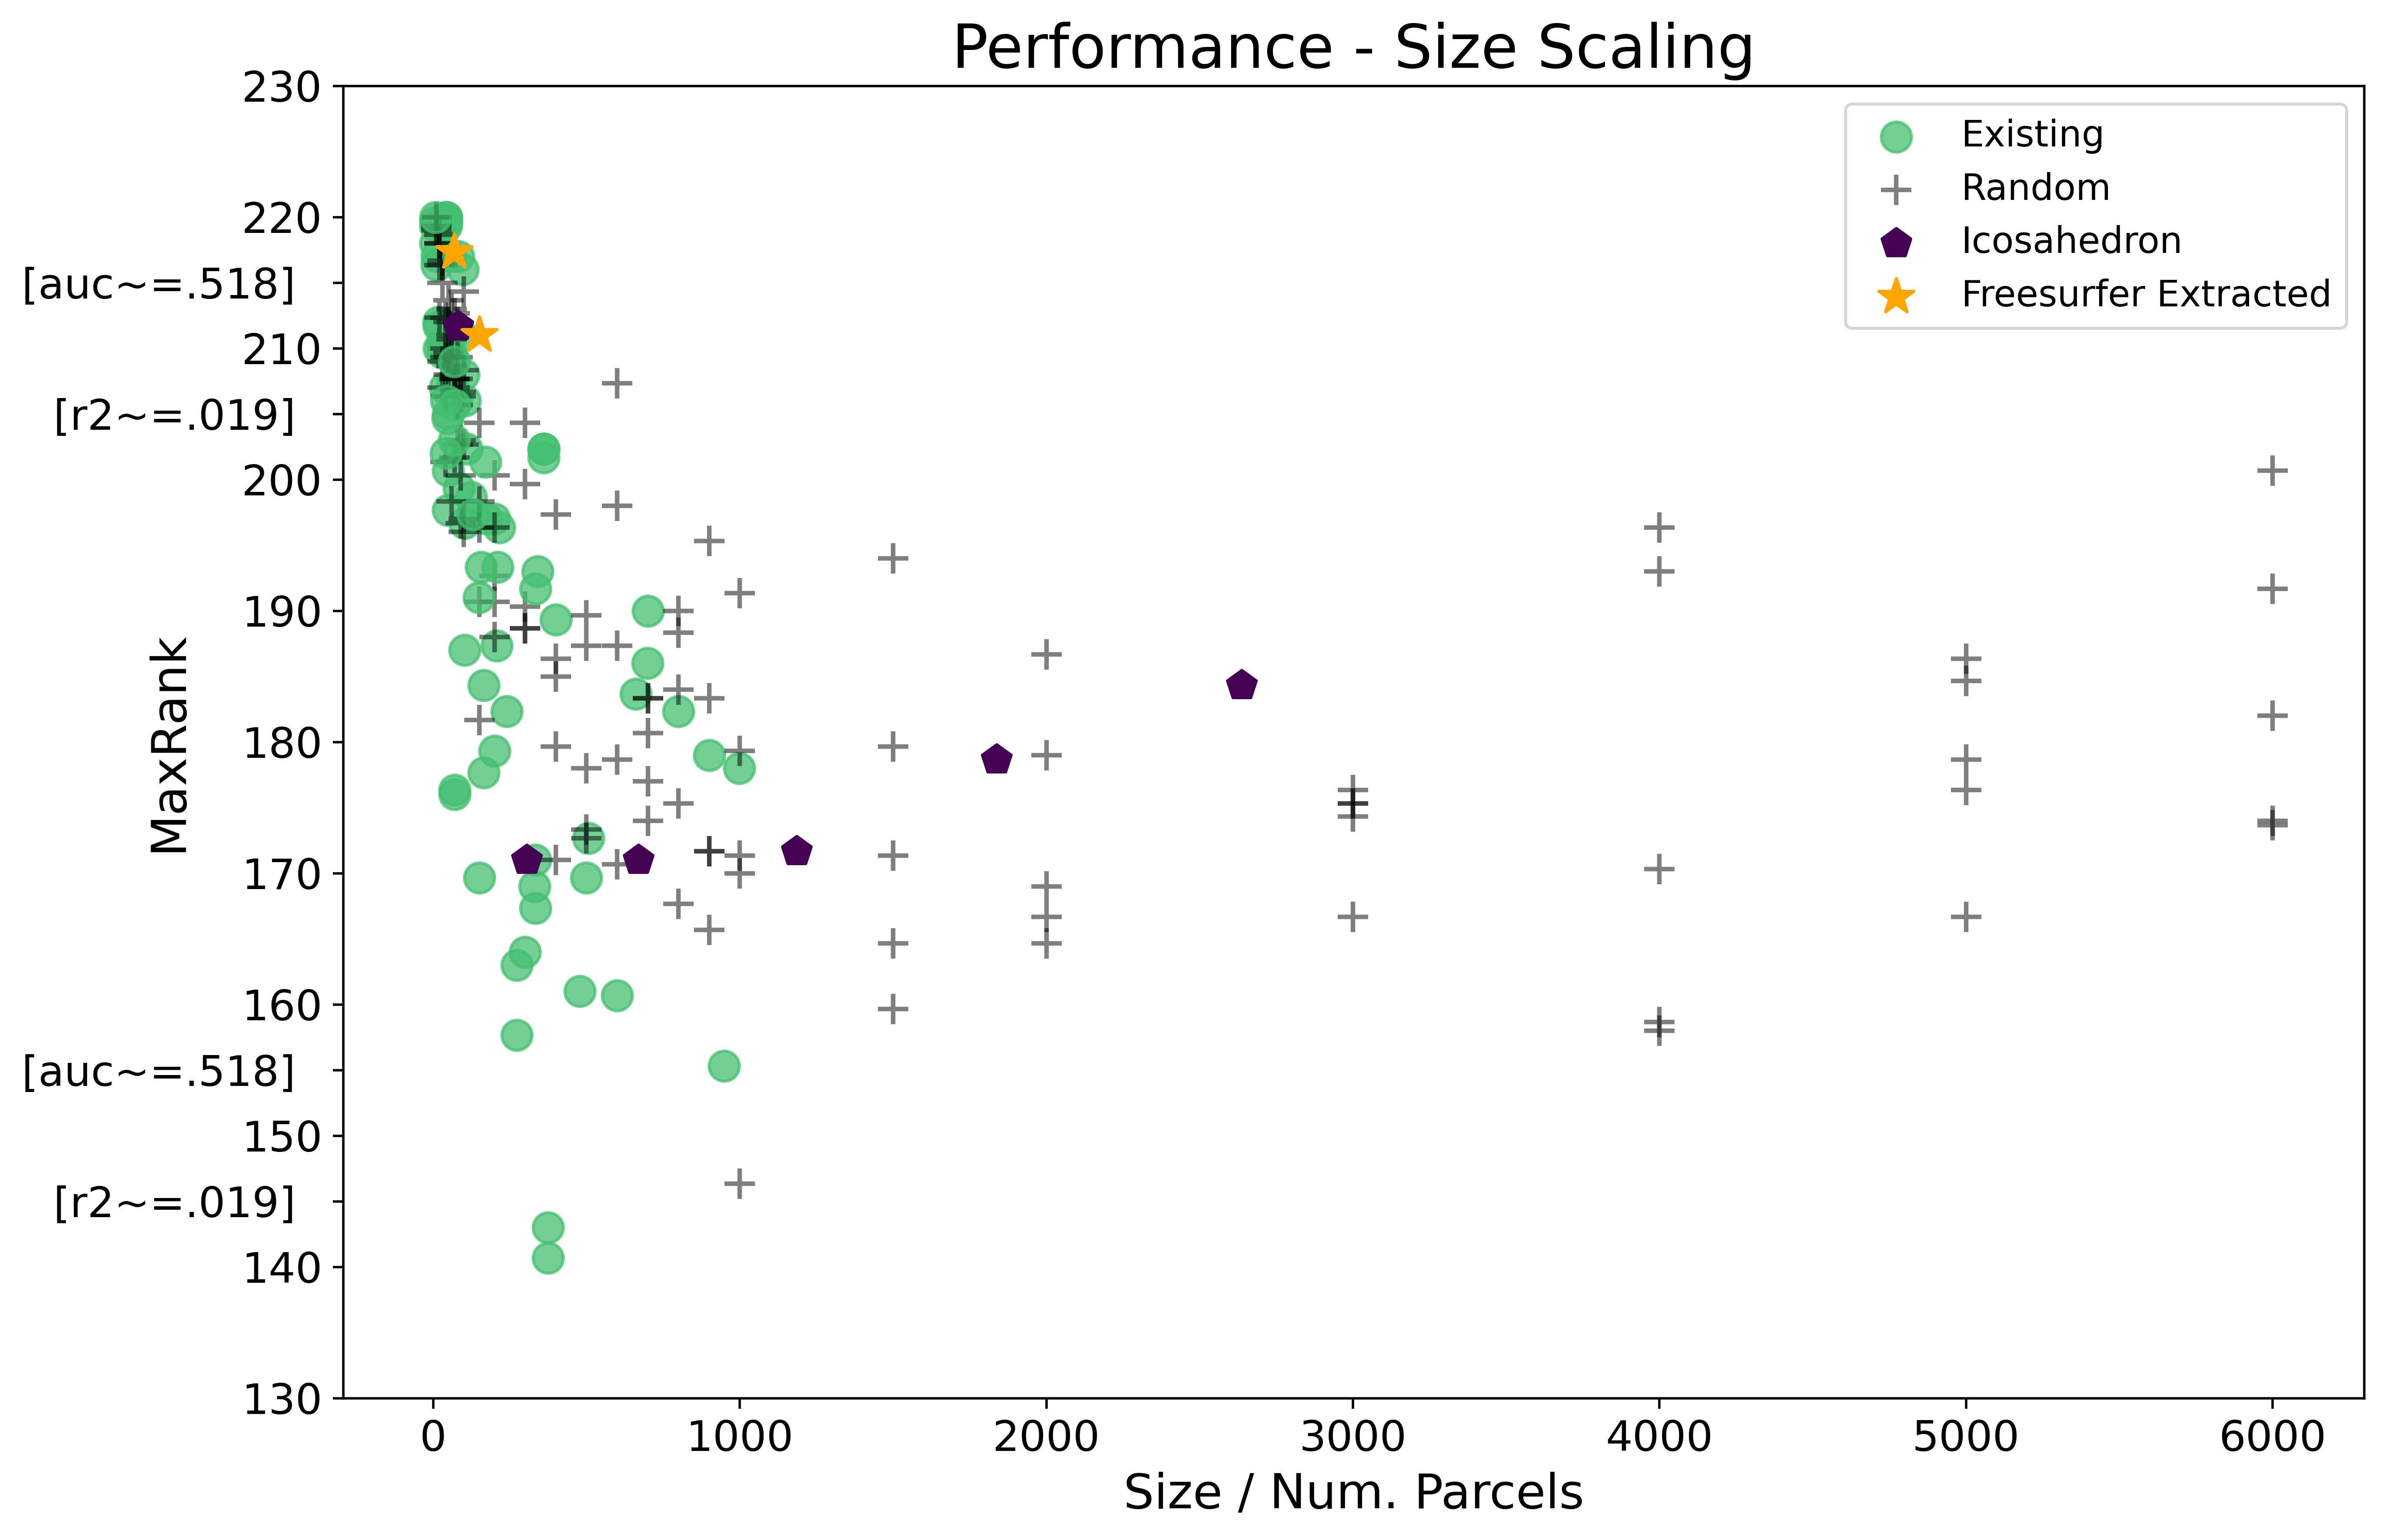
Max Rank
Using Max Rank is actually quite different than using mean or median. Instead, what max ranks tells us is essentially the worst case performance of a parcellation across target variables,
| Dep. Variable: | Max_Rank | R-squared: | 0.598 |
|---|---|---|---|
| Model: | OLS | Adj. R-squared: | 0.589 |
| Method: | Least Squares | F-statistic: | 68.07 |
| Date: | Tue, 11 Jan 2022 | Prob (F-statistic): | 3.38e-35 |
| coef | std err | t | P>|t| | [0.025 | 0.975] | |
|---|---|---|---|---|---|---|
| Intercept | 2.4070 | 0.008 | 287.023 | 0.000 | 2.390 | 2.424 |
| C(Parcellation_Type)[T.Freesurfer Extracted] | 0.0394 | 0.019 | 2.098 | 0.037 | 0.002 | 0.076 |
| C(Parcellation_Type)[T.Icosahedron] | 0.0136 | 0.011 | 1.201 | 0.231 | -0.009 | 0.036 |
| C(Parcellation_Type)[T.Random] | 0.0132 | 0.004 | 3.287 | 0.001 | 0.005 | 0.021 |
| Size | -0.0577 | 0.004 | -16.094 | 0.000 | -0.065 | -0.051 |
To match the plot above, and to limit the complexity of the plot, we just show fits for existing and random type parcellations.
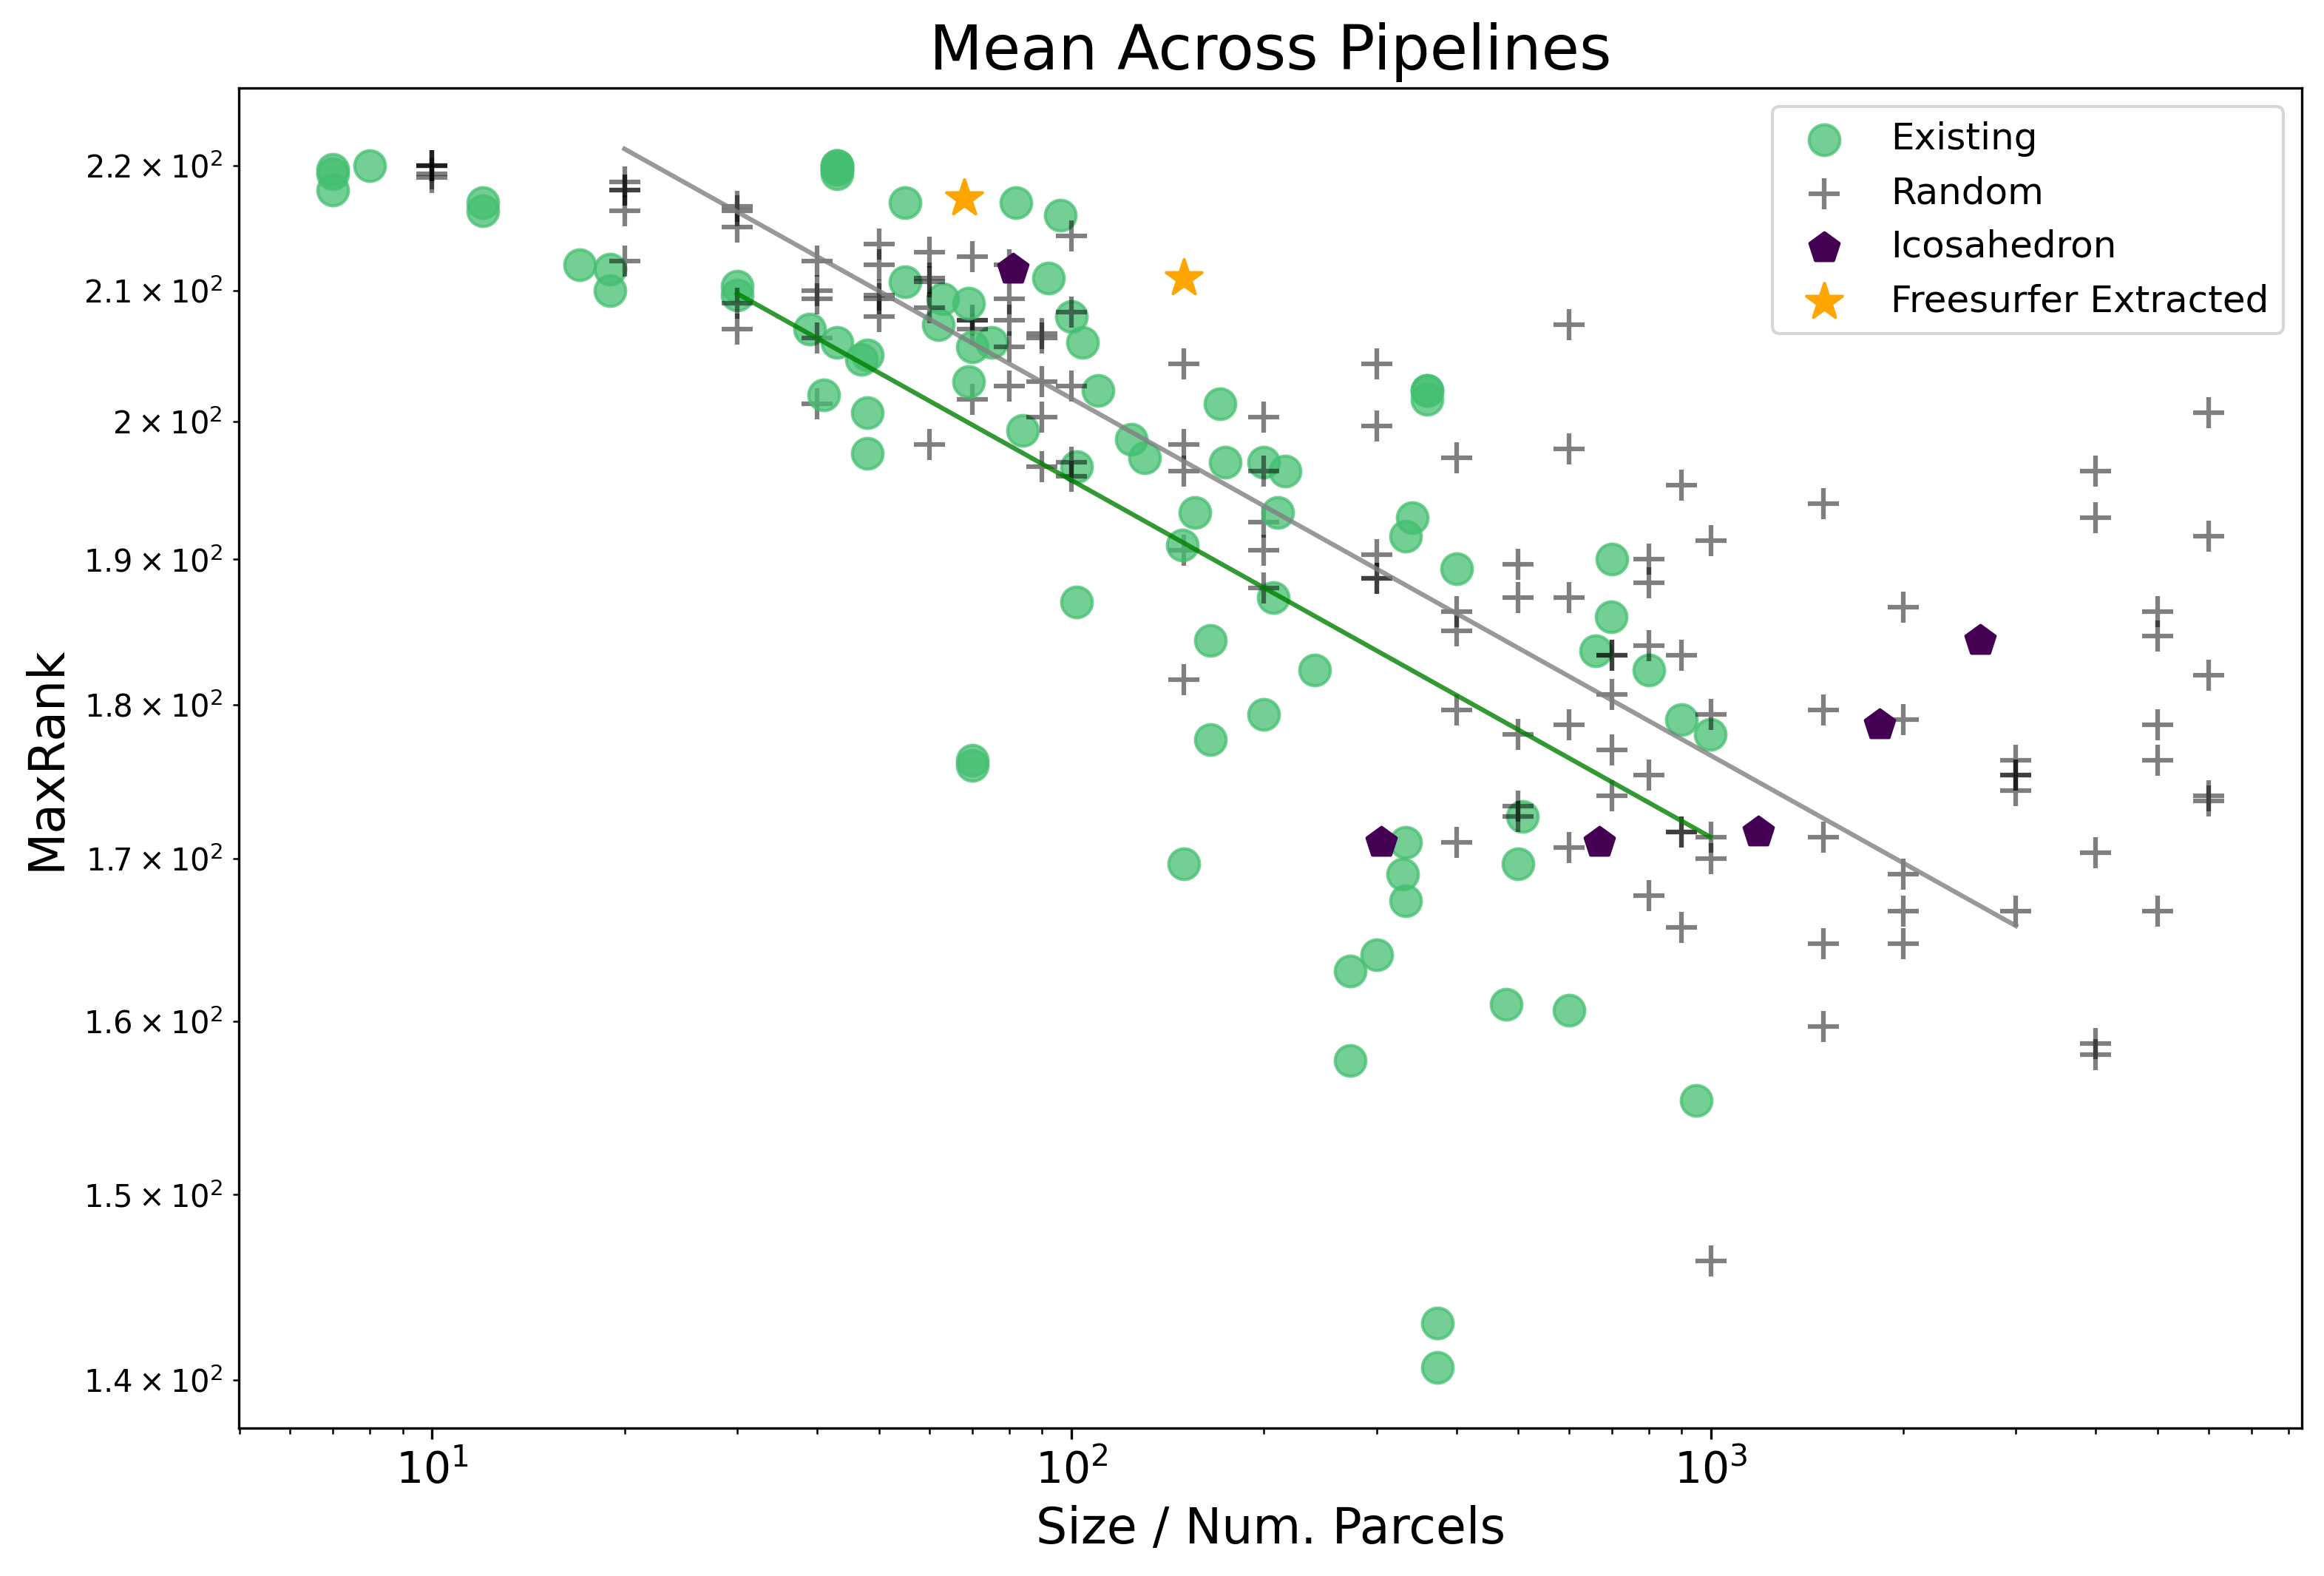
A recreation of the main figure from the index page, but with max rank is provided here:
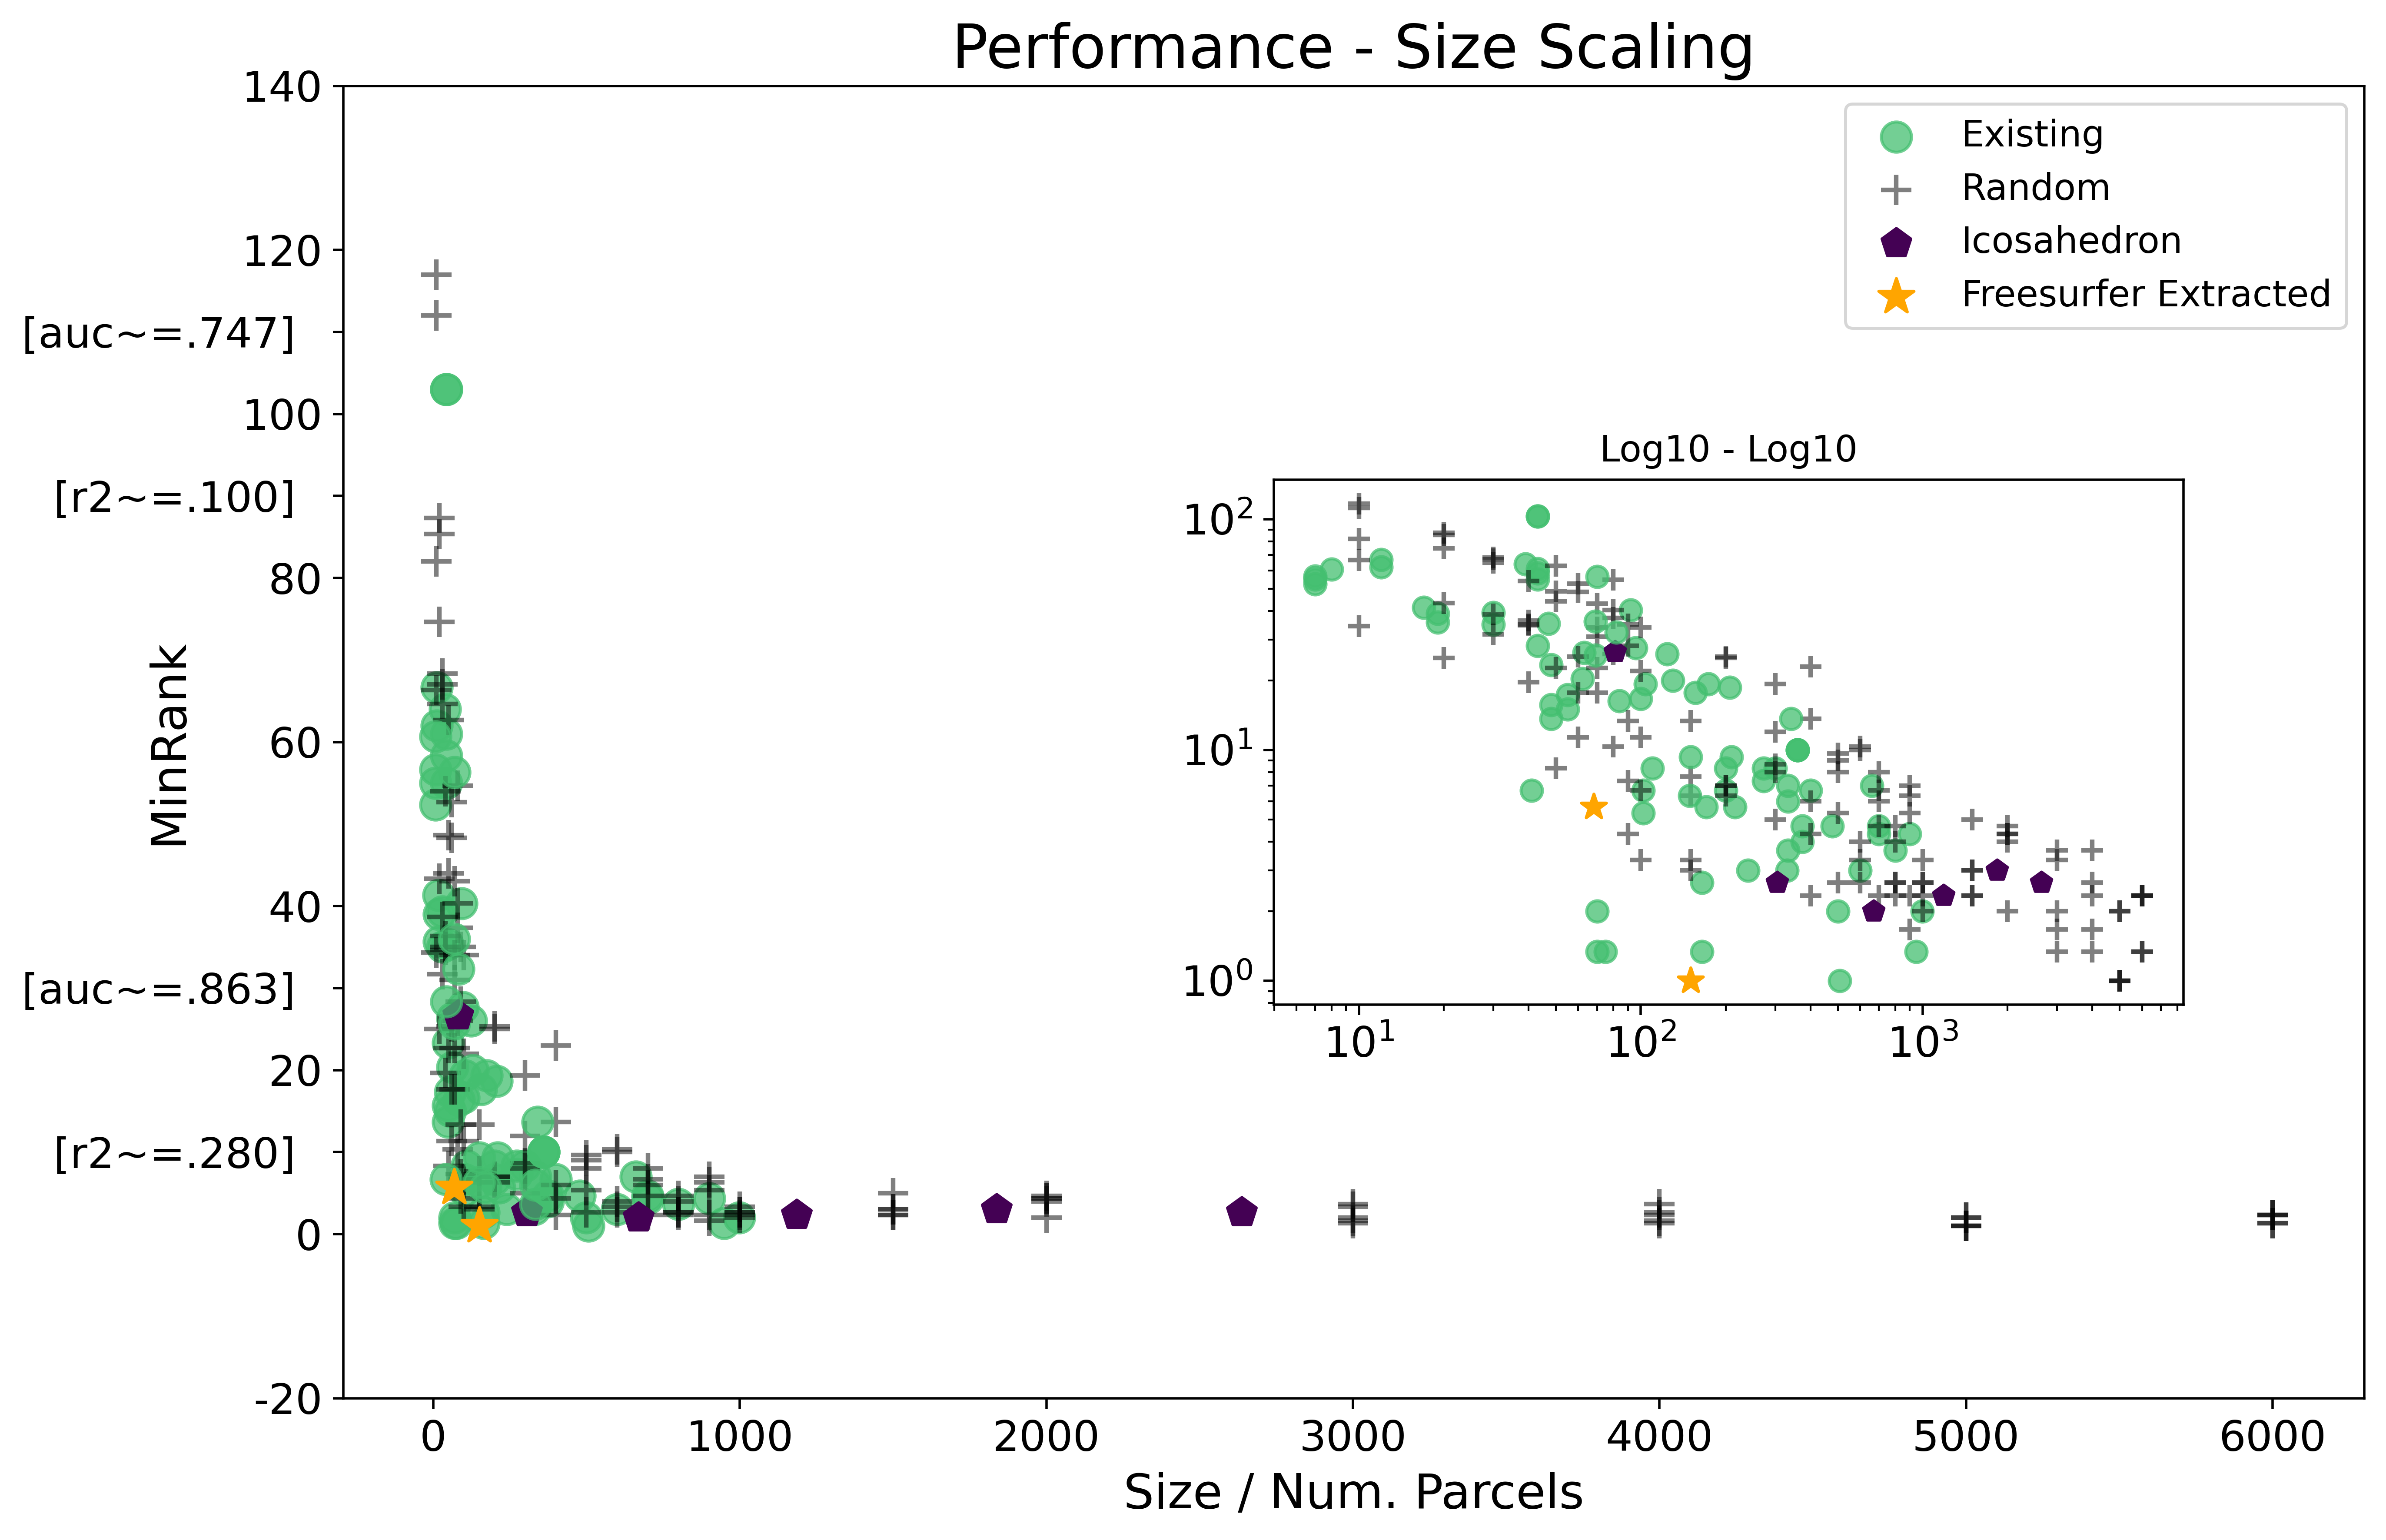
Min Rank
Using Min Rank is similarly different to Mean and Median like Max Rank, but describes the best case performance.
| Dep. Variable: | Min_Rank | R-squared: | 0.659 |
|---|---|---|---|
| Model: | OLS | Adj. R-squared: | 0.652 |
| Method: | Least Squares | F-statistic: | 91.42 |
| Date: | Tue, 11 Jan 2022 | Prob (F-statistic): | 4.13e-43 |
| coef | std err | t | P>|t| | [0.025 | 0.975] | |
|---|---|---|---|---|---|---|
| Intercept | 2.5413 | 0.087 | 29.240 | 0.000 | 2.370 | 2.713 |
| C(Parcellation_Type)[T.Freesurfer Extracted] | -0.7463 | 0.216 | -3.457 | 0.001 | -1.172 | -0.320 |
| C(Parcellation_Type)[T.Icosahedron] | -0.0231 | 0.141 | -0.164 | 0.870 | -0.301 | 0.255 |
| C(Parcellation_Type)[T.Random] | 0.1130 | 0.045 | 2.513 | 0.013 | 0.024 | 0.202 |
| Size | -0.7076 | 0.038 | -18.553 | 0.000 | -0.783 | -0.632 |
To match the plot above, and to limit the complexity of the plot, we just show fits for existing and random type parcellations.
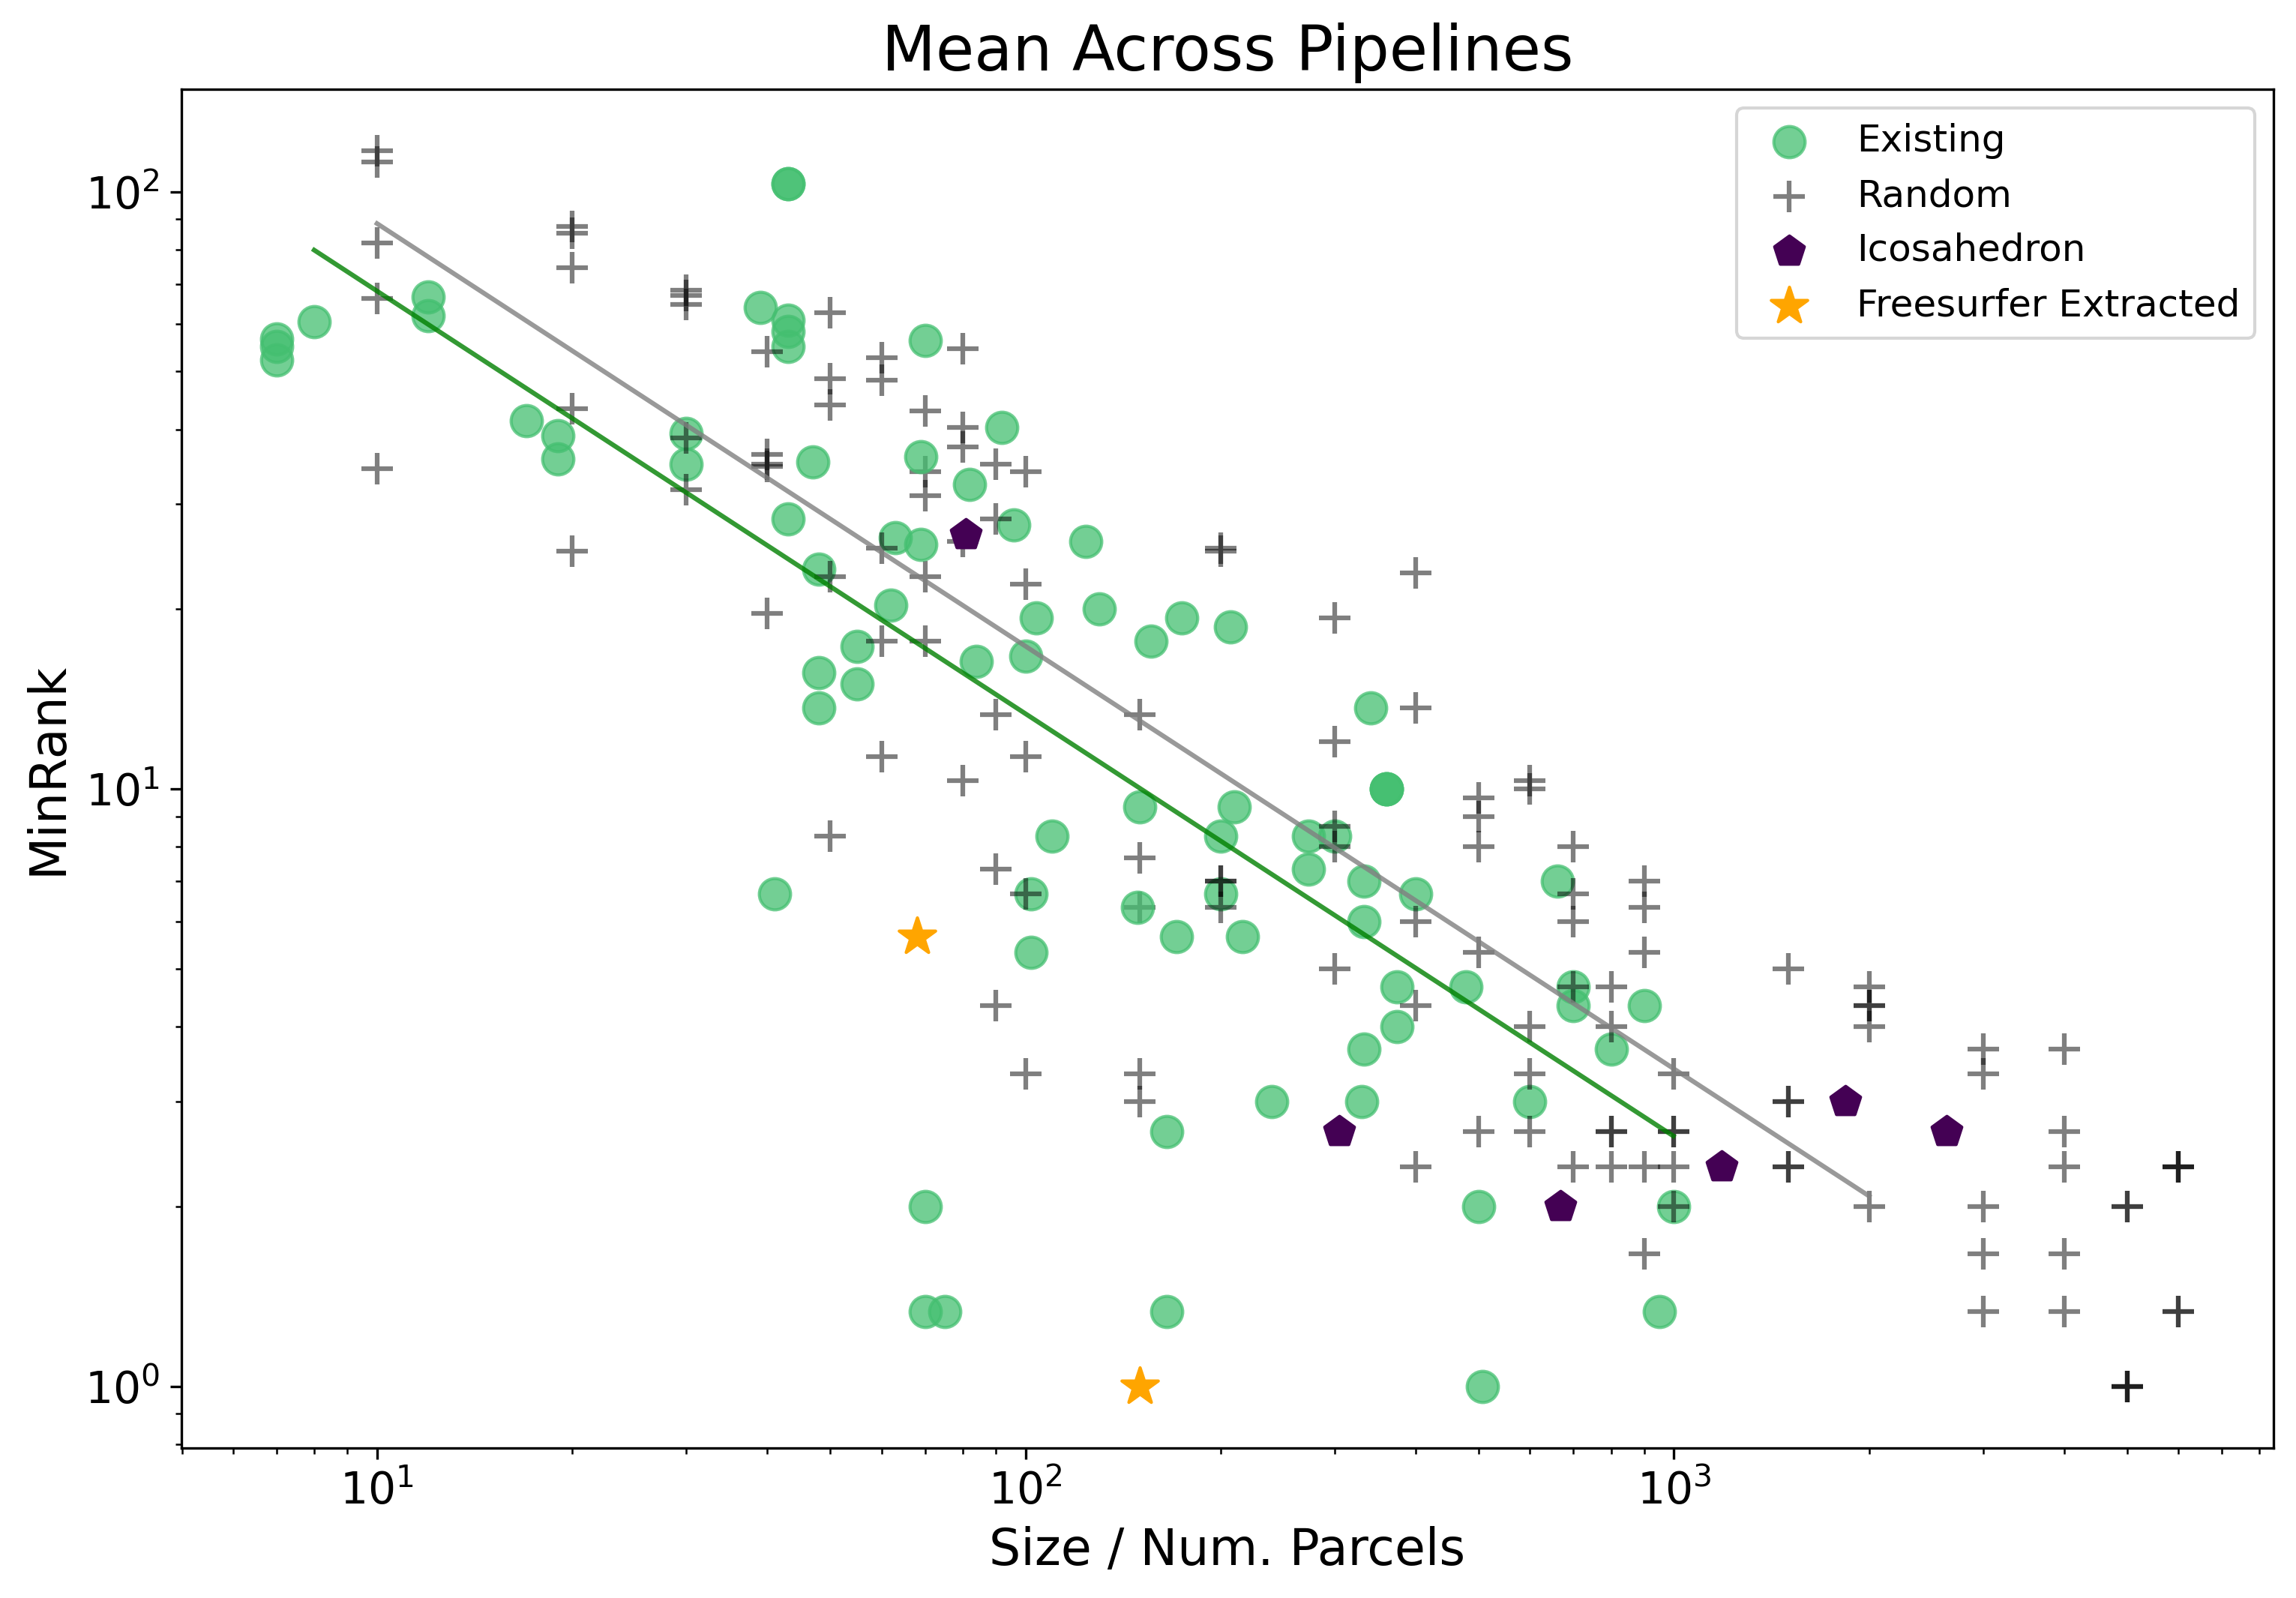
A recreation of the main figure from the index page, but with min rank is provided here: