Ensemble Results by Pipeline
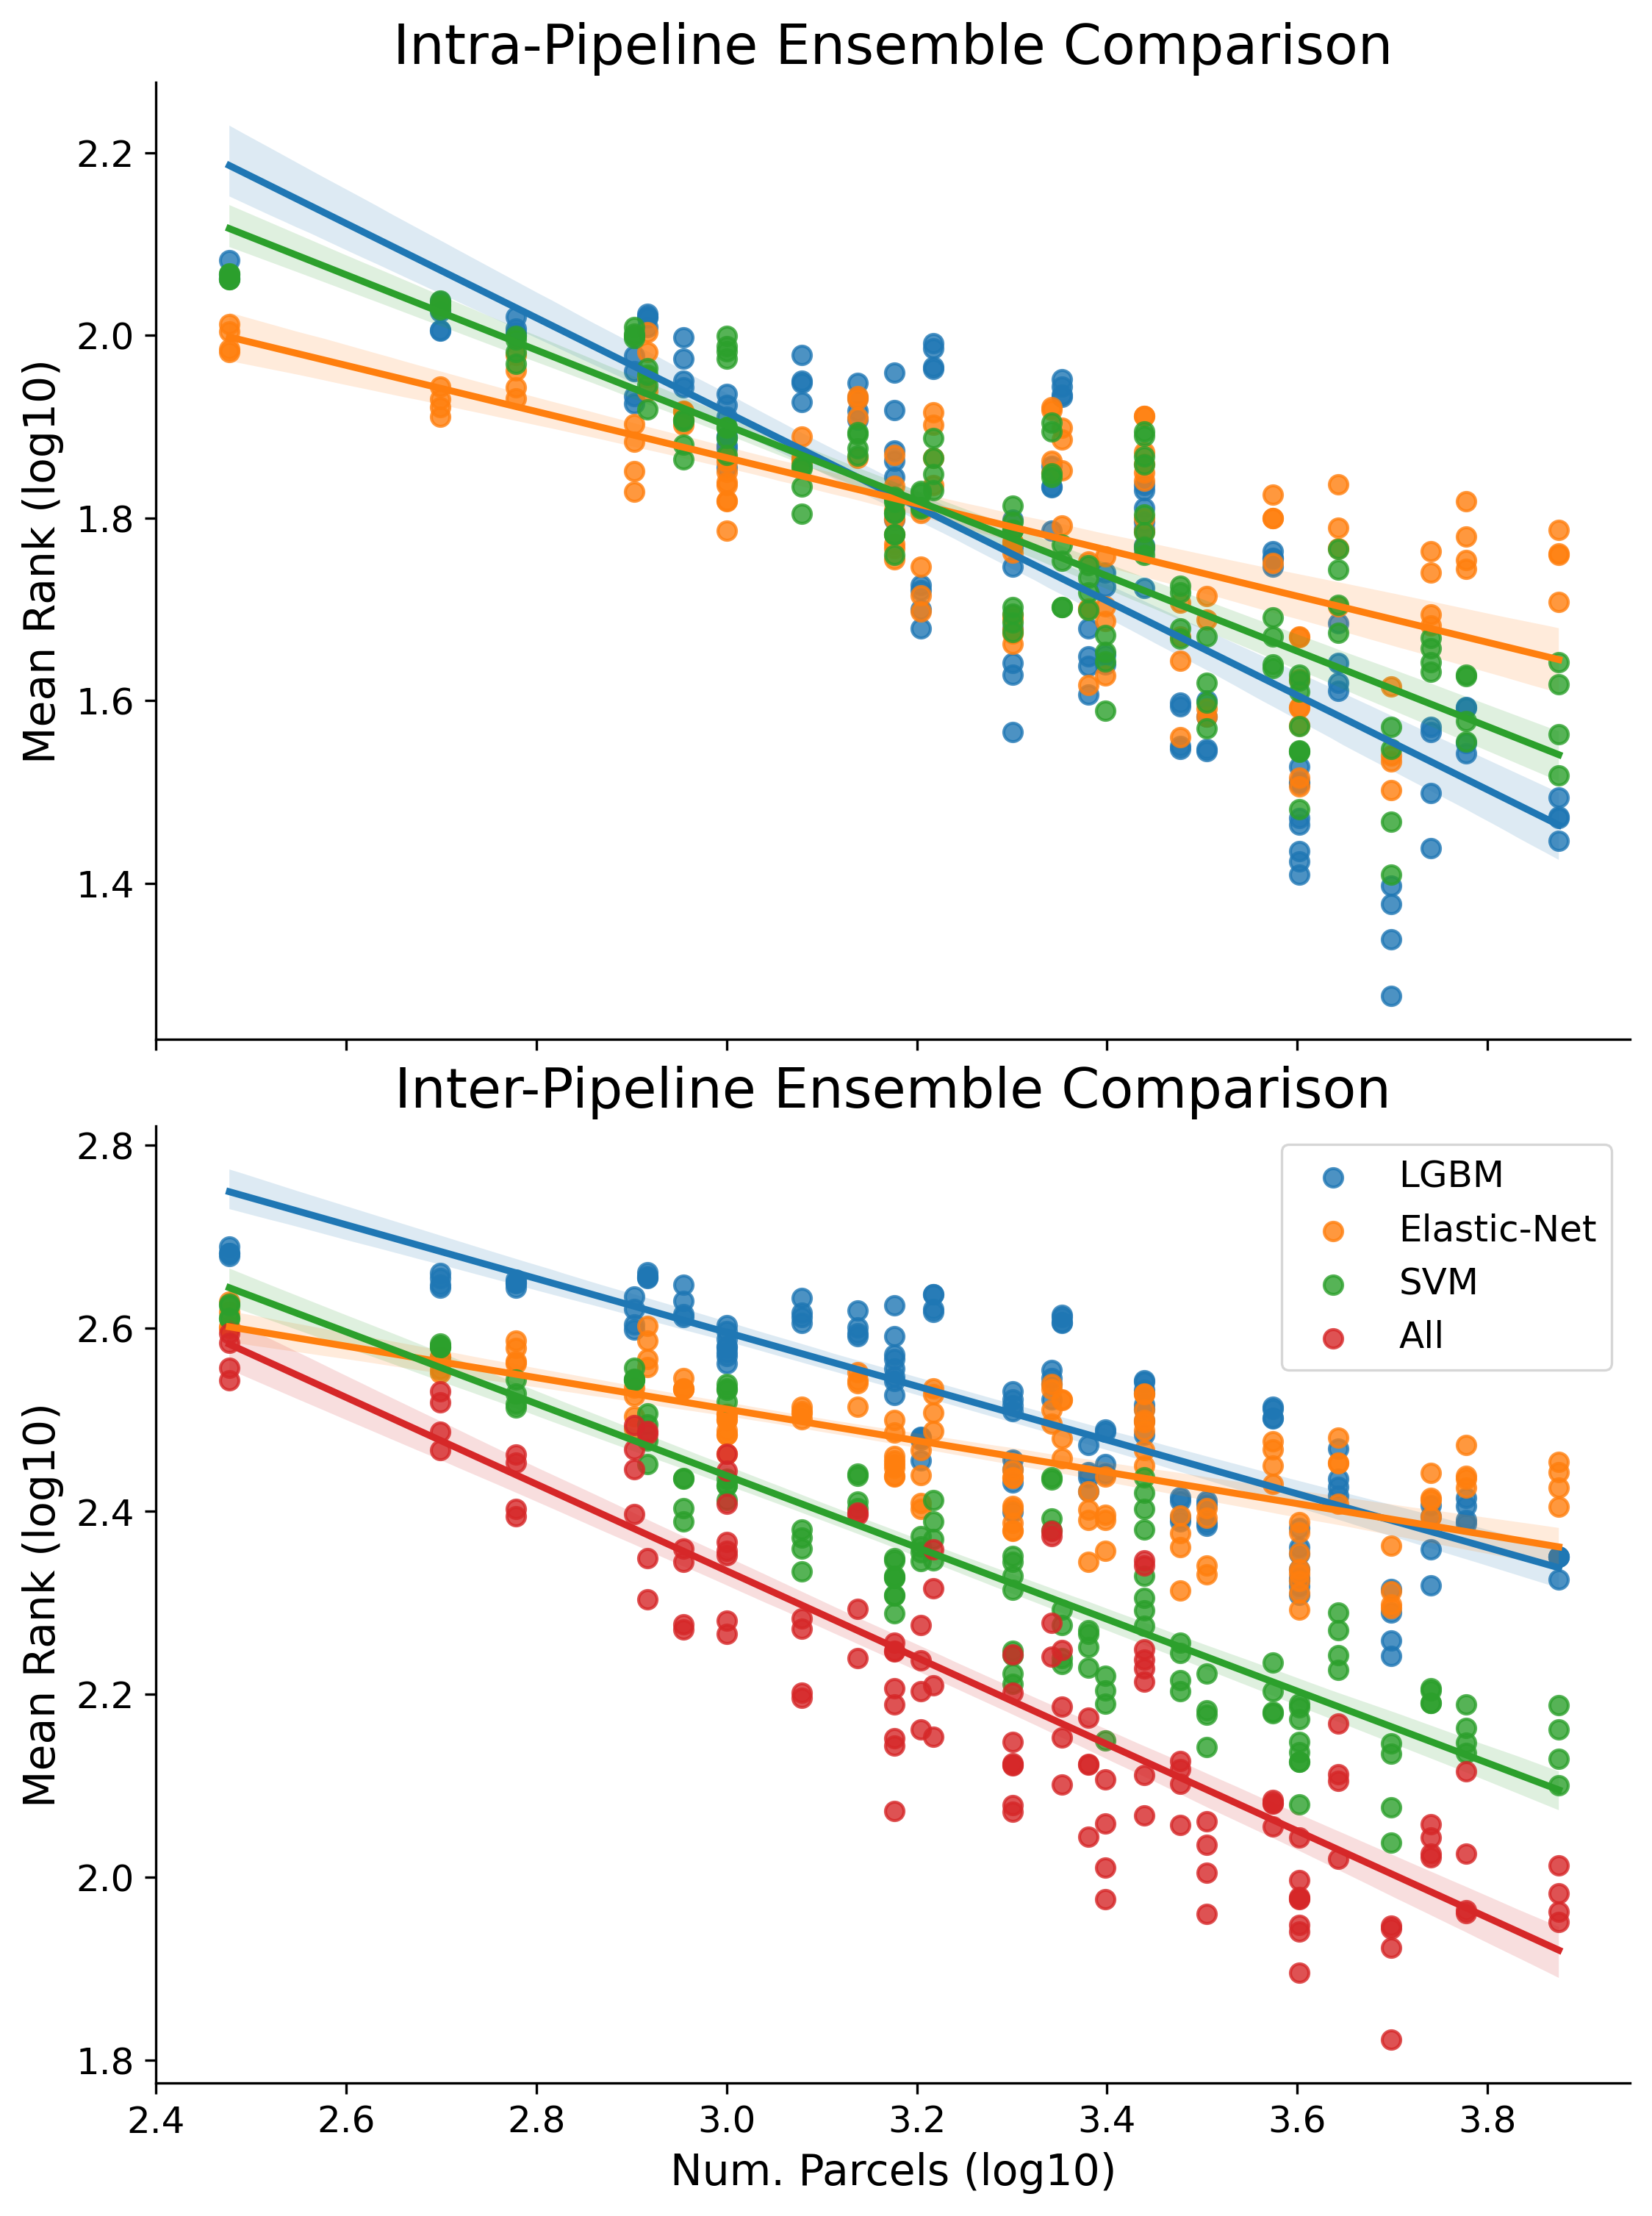
We break down just the ensemble based multiple parcellation results here as both intra and inter pipeline (corresponding to the top and bottom of the figure below).

-
The top part of the figure, Intra-Pipeline Comparison, shows mean rank for each ensemble of pipelines as computed only relative to other parcellations evaluated with the same pipeline
-
The bottom part of the figure, Inter-Pipeline Comparison, shows mean rank as calculated between each combination.
-
The regression line of best fit on the log10-log10 data are plotted separately for each pipeline across both figures (shaded regions around the lines of fit represent the bootstrap estimated 95% CI). The OLS fit here was with robust regression.
These results are interesting when contrasted with the same single parcellation results by pipeline.
Intra-Pipeline
Click Here for a fullscreen version of the plot.
Note: You can watch an animation of how specific results change with with different pipelines. You can also hover over specific data points to find out more information. You can also find a version of the interactive plot with non log10 axis here.
The pattern of the intra ensemble stays fairly consistent across pipelines. One interesting trait is that the LGBM based pipeline exhibits the steepest scaling slope.
- Click here to see the full results table containing ensemble inter-pipeline specific results.
- See also ensembled Intra-Pipeline results as plotted by raw metric here
Inter-Pipeline
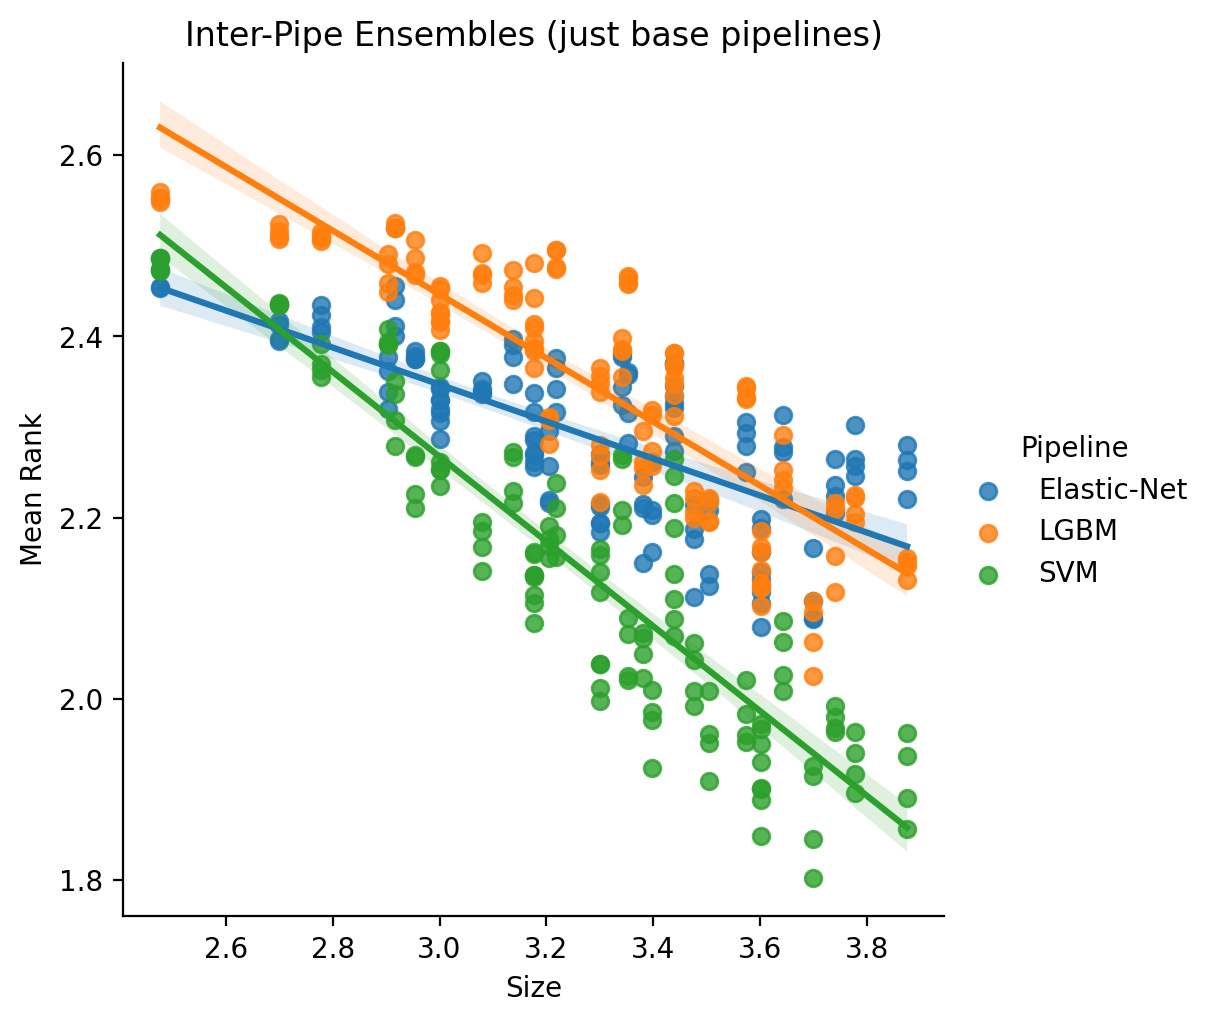
When looking at inter-pipeline differences, we focus first on just a comparison between the base three pipelines, excluding the ‘All’ ensembles for now.
Formula: log10(Mean_Rank) ~ log10(Size) * C(Pipeline)
| Dep. Variable: | Mean_Rank | R-squared: | 0.828 |
|---|---|---|---|
| Model: | OLS | Adj. R-squared: | 0.826 |
| Method: | Least Squares | F-statistic: | 364.3 |
| Date: | Mon, 13 Sep 2021 | Prob (F-statistic): | 4.23e-142 |
| coef | std err | t | P>|t| | [0.025 | 0.975] | |
|---|---|---|---|---|---|---|
| Intercept | 2.9596 | 0.060 | 49.020 | 0.000 | 2.841 | 3.078 |
| C(Pipeline)[T.LGBM] | 0.5425 | 0.085 | 6.354 | 0.000 | 0.375 | 0.710 |
| C(Pipeline)[T.SVM] | 0.7116 | 0.085 | 8.334 | 0.000 | 0.544 | 0.879 |
| Size | -0.2042 | 0.018 | -11.173 | 0.000 | -0.240 | -0.168 |
| Size:C(Pipeline)[T.LGBM] | -0.1476 | 0.026 | -5.711 | 0.000 | -0.198 | -0.097 |
| Size:C(Pipeline)[T.SVM] | -0.2637 | 0.026 | -10.201 | 0.000 | -0.315 | -0.213 |

We can conclude here that the SVM based ensembles of pipelines outperforms the Elastic-Net and LGBM based ensembles. That said, the differential performance is not quite as large as we saw earlier in the simmilar inter-pipeline single parcellation comparison.
- Click here to see the full results table containing ensemble inter-pipeline specific results.
All Intra-Pipeline
Included below is an interactive intra-pipeline visualization including results across both the single parcellations and multiple parcellations Click Here for a fullscreen version of the plot.