Ensemble Comparison
Voted Vs Stacked
From the base Multiple Parcellations Experiment we see that the two ensemble
strategies seem to yield very simmilar results. We can formally test this intuition by modelling
a subset of the just the “Voted” and “Stacked” results.
Formula: log10(Mean_Rank) ~ log10(Size) + C(Parcellation_Type) (where Parcellation_Type just has two categories)
| Dep. Variable: | Mean_Rank | R-squared: | 0.753 |
|---|---|---|---|
| Model: | OLS | Adj. R-squared: | 0.749 |
| Method: | Least Squares | F-statistic: | 190.5 |
| Date: | Mon, 13 Sep 2021 | Prob (F-statistic): | 1.12e-38 |
| coef | std err | t | P>|t| | [0.025 | 0.975] | |
|---|---|---|---|---|---|---|
| Intercept | 3.0516 | 0.066 | 46.289 | 0.000 | 2.921 | 3.182 |
| C(Parcellation_Type)[T.Voted] | 0.0130 | 0.013 | 0.999 | 0.320 | -0.013 | 0.039 |
| Size | -0.3872 | 0.020 | -19.494 | 0.000 | -0.426 | -0.348 |
We can also model allowing for interactions: log10(Mean_Rank) ~ log10(Size) * C(Parcellation_Type)
| Dep. Variable: | Mean_Rank | R-squared: | 0.753 |
|---|---|---|---|
| Model: | OLS | Adj. R-squared: | 0.747 |
| Method: | Least Squares | F-statistic: | 126.1 |
| Date: | Mon, 13 Sep 2021 | Prob (F-statistic): | 1.66e-37 |
| coef | std err | t | P>|t| | [0.025 | 0.975] | |
|---|---|---|---|---|---|---|
| Intercept | 3.0722 | 0.093 | 32.996 | 0.000 | 2.888 | 3.257 |
| C(Parcellation_Type)[T.Voted] | -0.0283 | 0.132 | -0.215 | 0.830 | -0.289 | 0.232 |
| Size | -0.3935 | 0.028 | -13.957 | 0.000 | -0.449 | -0.338 |
| Size:C(Parcellation_Type)[T.Voted] | 0.0126 | 0.040 | 0.315 | 0.753 | -0.066 | 0.091 |
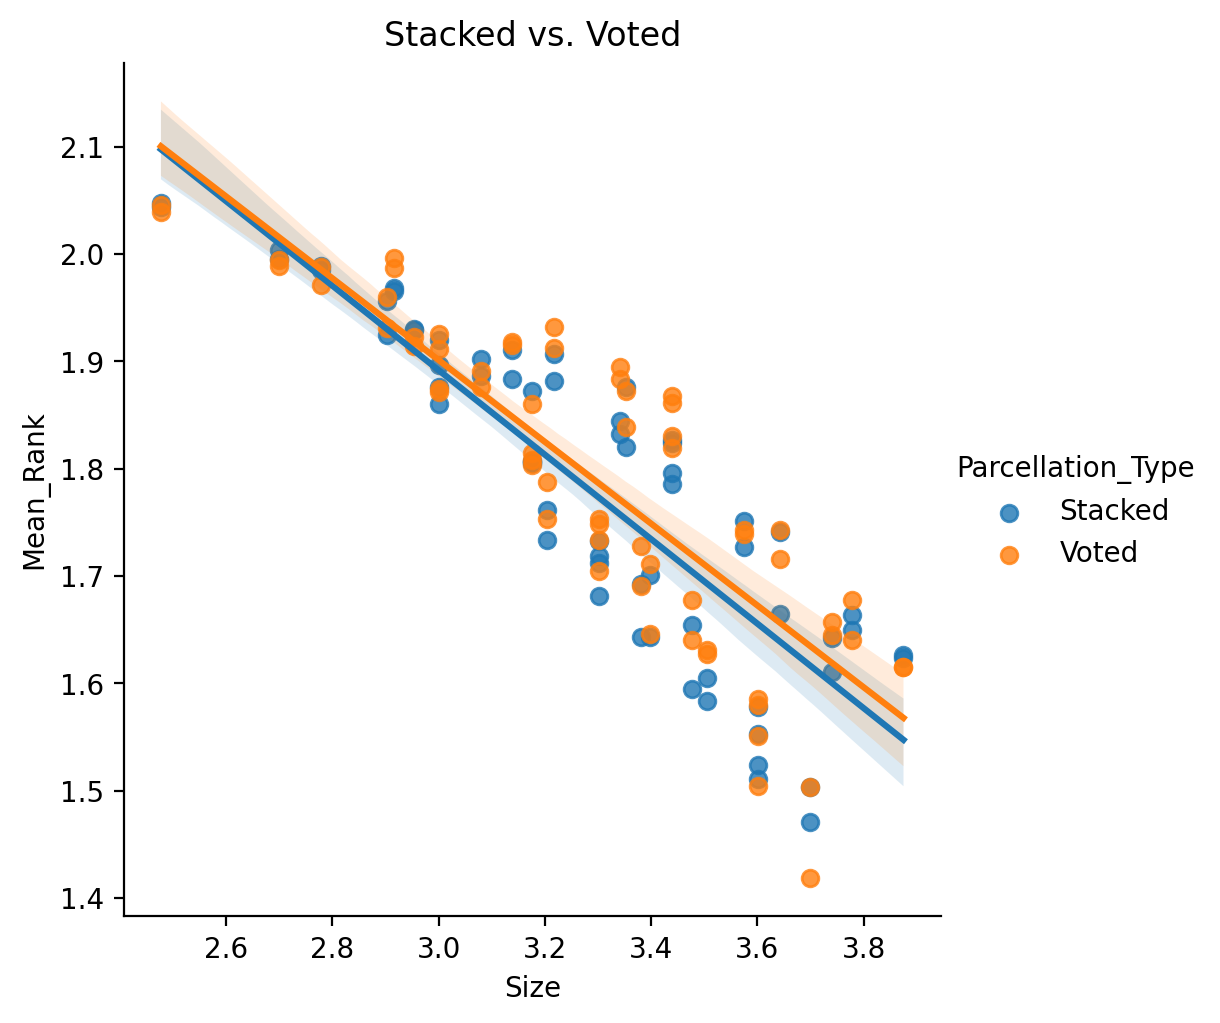
In both the formal statistics and visualizing the results we see no significant differences in performance between the two methods, or significant interactions with Size.
- See also full results table.
More to the story?
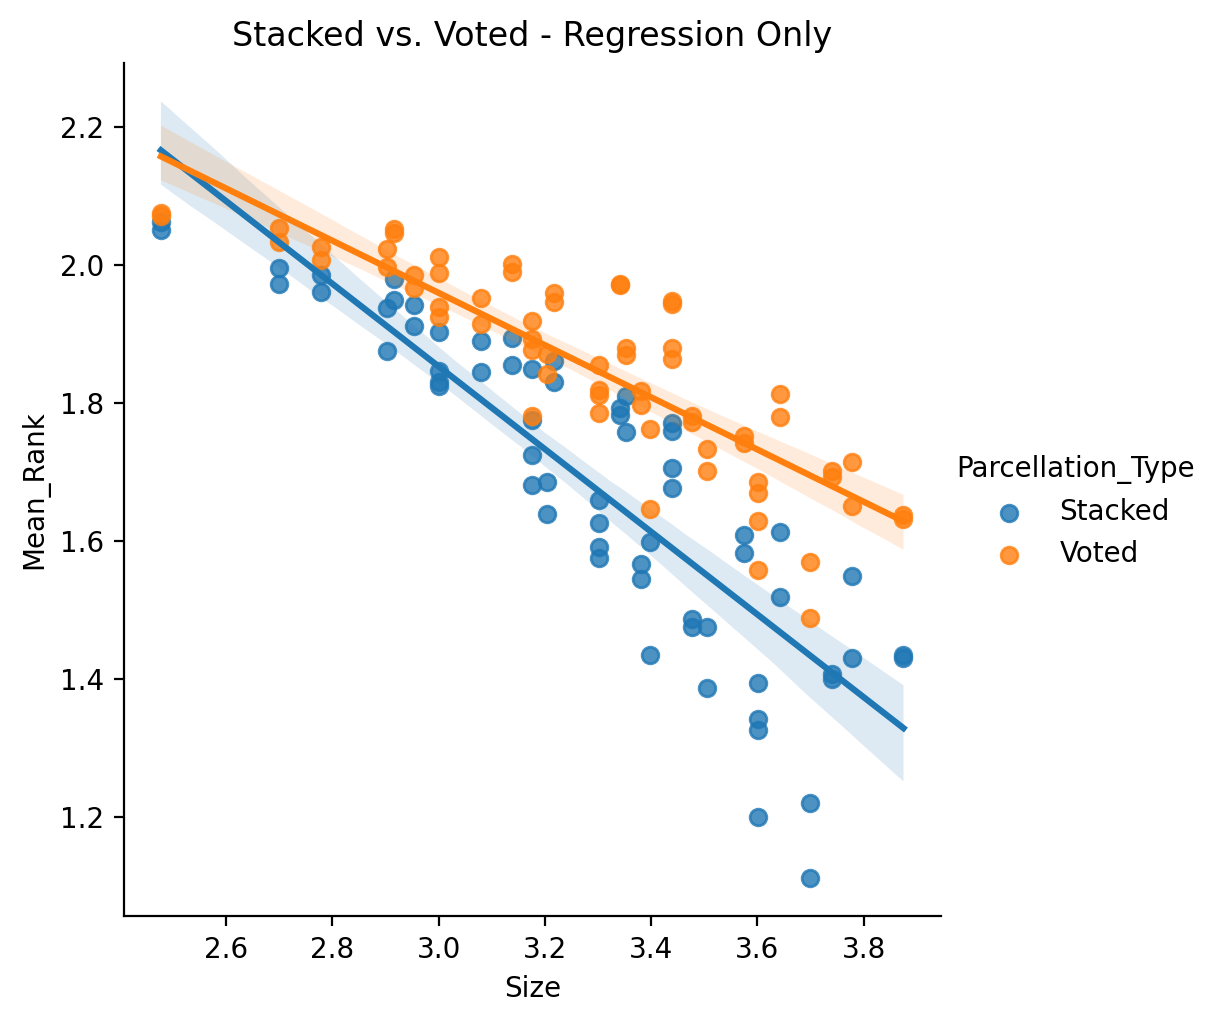
Interestingly, if we go to the sortable results table and sort by the default mean rank we find a mix of voted and stacked. If we sort by Mean R2 though… we find that all of the top results are from the stacking ensemble, and by Mean ROC AUC the opposite, all of the top results are from the voting ensemble.
We can more formally investigate this by running separate comparisons on just the binary target variables and just the regression based ones. First let’s look at the regression only:
| Dep. Variable: | Mean_Rank | R-squared: | 0.795 |
|---|---|---|---|
| Model: | OLS | Adj. R-squared: | 0.790 |
| Method: | Least Squares | F-statistic: | 160.2 |
| Date: | Mon, 13 Sep 2021 | Prob (F-statistic): | 1.77e-42 |
| coef | std err | t | P>|t| | [0.025 | 0.975] | |
|---|---|---|---|---|---|---|
| Intercept | 3.6496 | 0.120 | 30.375 | 0.000 | 3.412 | 3.887 |
| C(Parcellation_Type)[T.Voted] | -0.5556 | 0.170 | -3.270 | 0.001 | -0.892 | -0.219 |
| Size | -0.5991 | 0.036 | -16.468 | 0.000 | -0.671 | -0.527 |
| Size:C(Parcellation_Type)[T.Voted] | 0.2208 | 0.051 | 4.291 | 0.000 | 0.119 | 0.323 |
Now the binary only:
| Dep. Variable: | Mean_Rank | R-squared: | 0.723 |
|---|---|---|---|
| Model: | OLS | Adj. R-squared: | 0.716 |
| Method: | Least Squares | F-statistic: | 107.8 |
| Date: | Mon, 13 Sep 2021 | Prob (F-statistic): | 2.14e-34 |
| coef | std err | t | P>|t| | [0.025 | 0.975] | |
|---|---|---|---|---|---|---|
| Intercept | 2.7168 | 0.099 | 27.418 | 0.000 | 2.521 | 2.913 |
| C(Parcellation_Type)[T.Voted] | 0.2813 | 0.140 | 2.007 | 0.047 | 0.004 | 0.559 |
| Size | -0.2643 | 0.030 | -8.809 | 0.000 | -0.324 | -0.205 |
| Size:C(Parcellation_Type)[T.Voted] | -0.1233 | 0.042 | -2.905 | 0.004 | -0.207 | -0.039 |
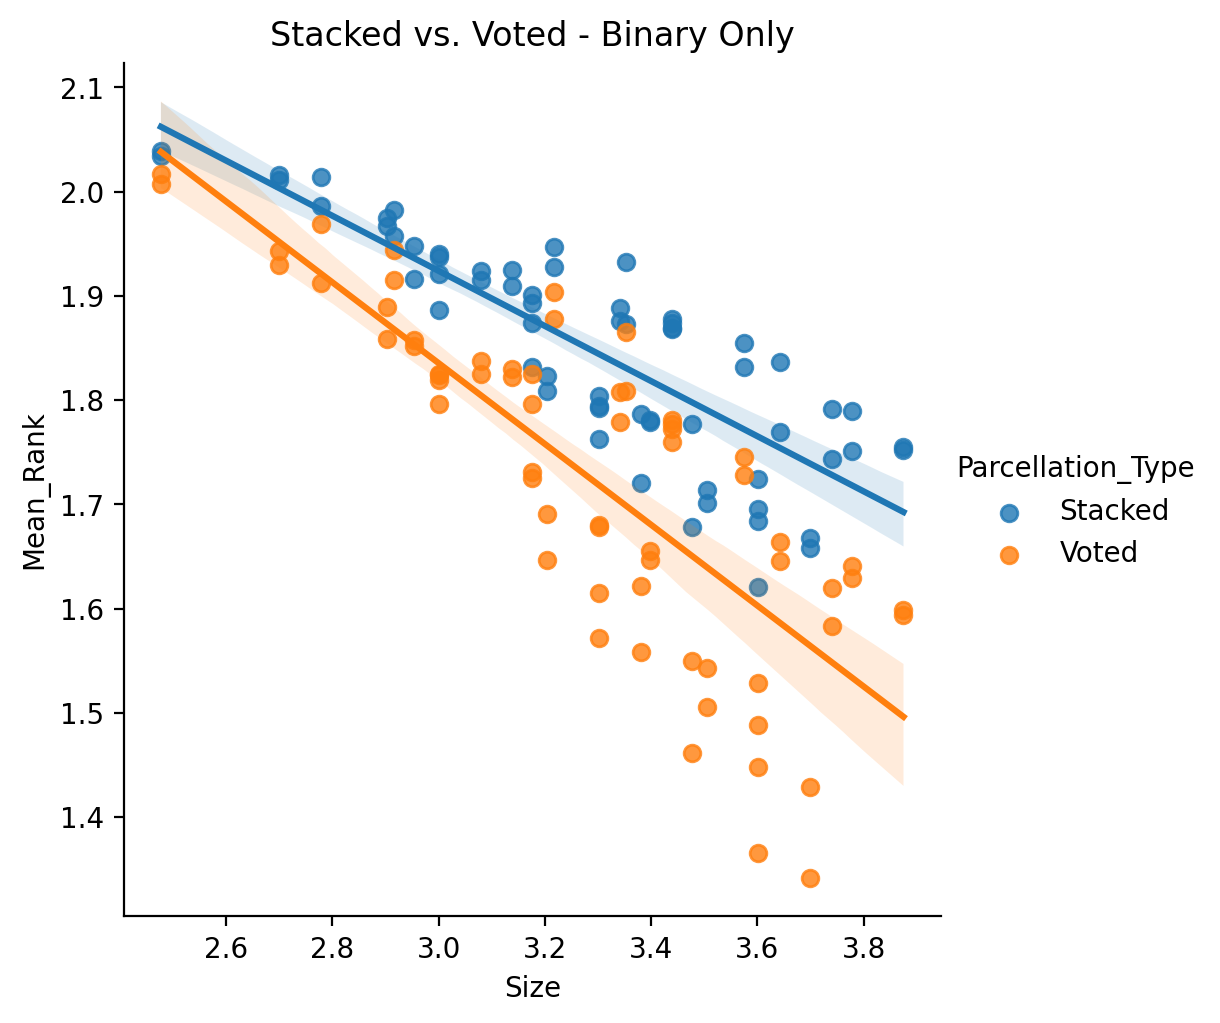
Hun, so which ensemble method works better actually ends up depending on if the prediction is regression or binary based. This could be related to some trait of binary optimization problems vs. regression… but it could also just be a problem or bug in the implementation of the stacking ensemble for binary variables. For now we will just tentatively present these results as is.
Fixed vs Across Sizes
Using again the subset of just “Voted”
and “Stacked” results we can investigate
a different question, namely, does the sourcing of the base parcellations matter? Specifically, is there a difference in ensemble based methods which draw from parcellations with all the same fixed size versus parcellations from a range of sizes? (See Multiple Parcellation Evaluation for more details. We create binary flag variable Across_Sizes to represent if results are from across multiple resolutions or not.
Formula: log10(Mean_Rank) ~ log10(Size) + C(Across_Sizes)
| Dep. Variable: | Mean_Rank | R-squared: | 0.933 |
|---|---|---|---|
| Model: | OLS | Adj. R-squared: | 0.932 |
| Method: | Least Squares | F-statistic: | 870.8 |
| Date: | Mon, 13 Sep 2021 | Prob (F-statistic): | 4.14e-74 |
| coef | std err | t | P>|t| | [0.025 | 0.975] | |
|---|---|---|---|---|---|---|
| Intercept | 3.2758 | 0.036 | 90.641 | 0.000 | 3.204 | 3.347 |
| C(Across_Sizes)[T.1] | 0.1409 | 0.008 | 18.433 | 0.000 | 0.126 | 0.156 |
| Size | -0.4695 | 0.011 | -41.680 | 0.000 | -0.492 | -0.447 |
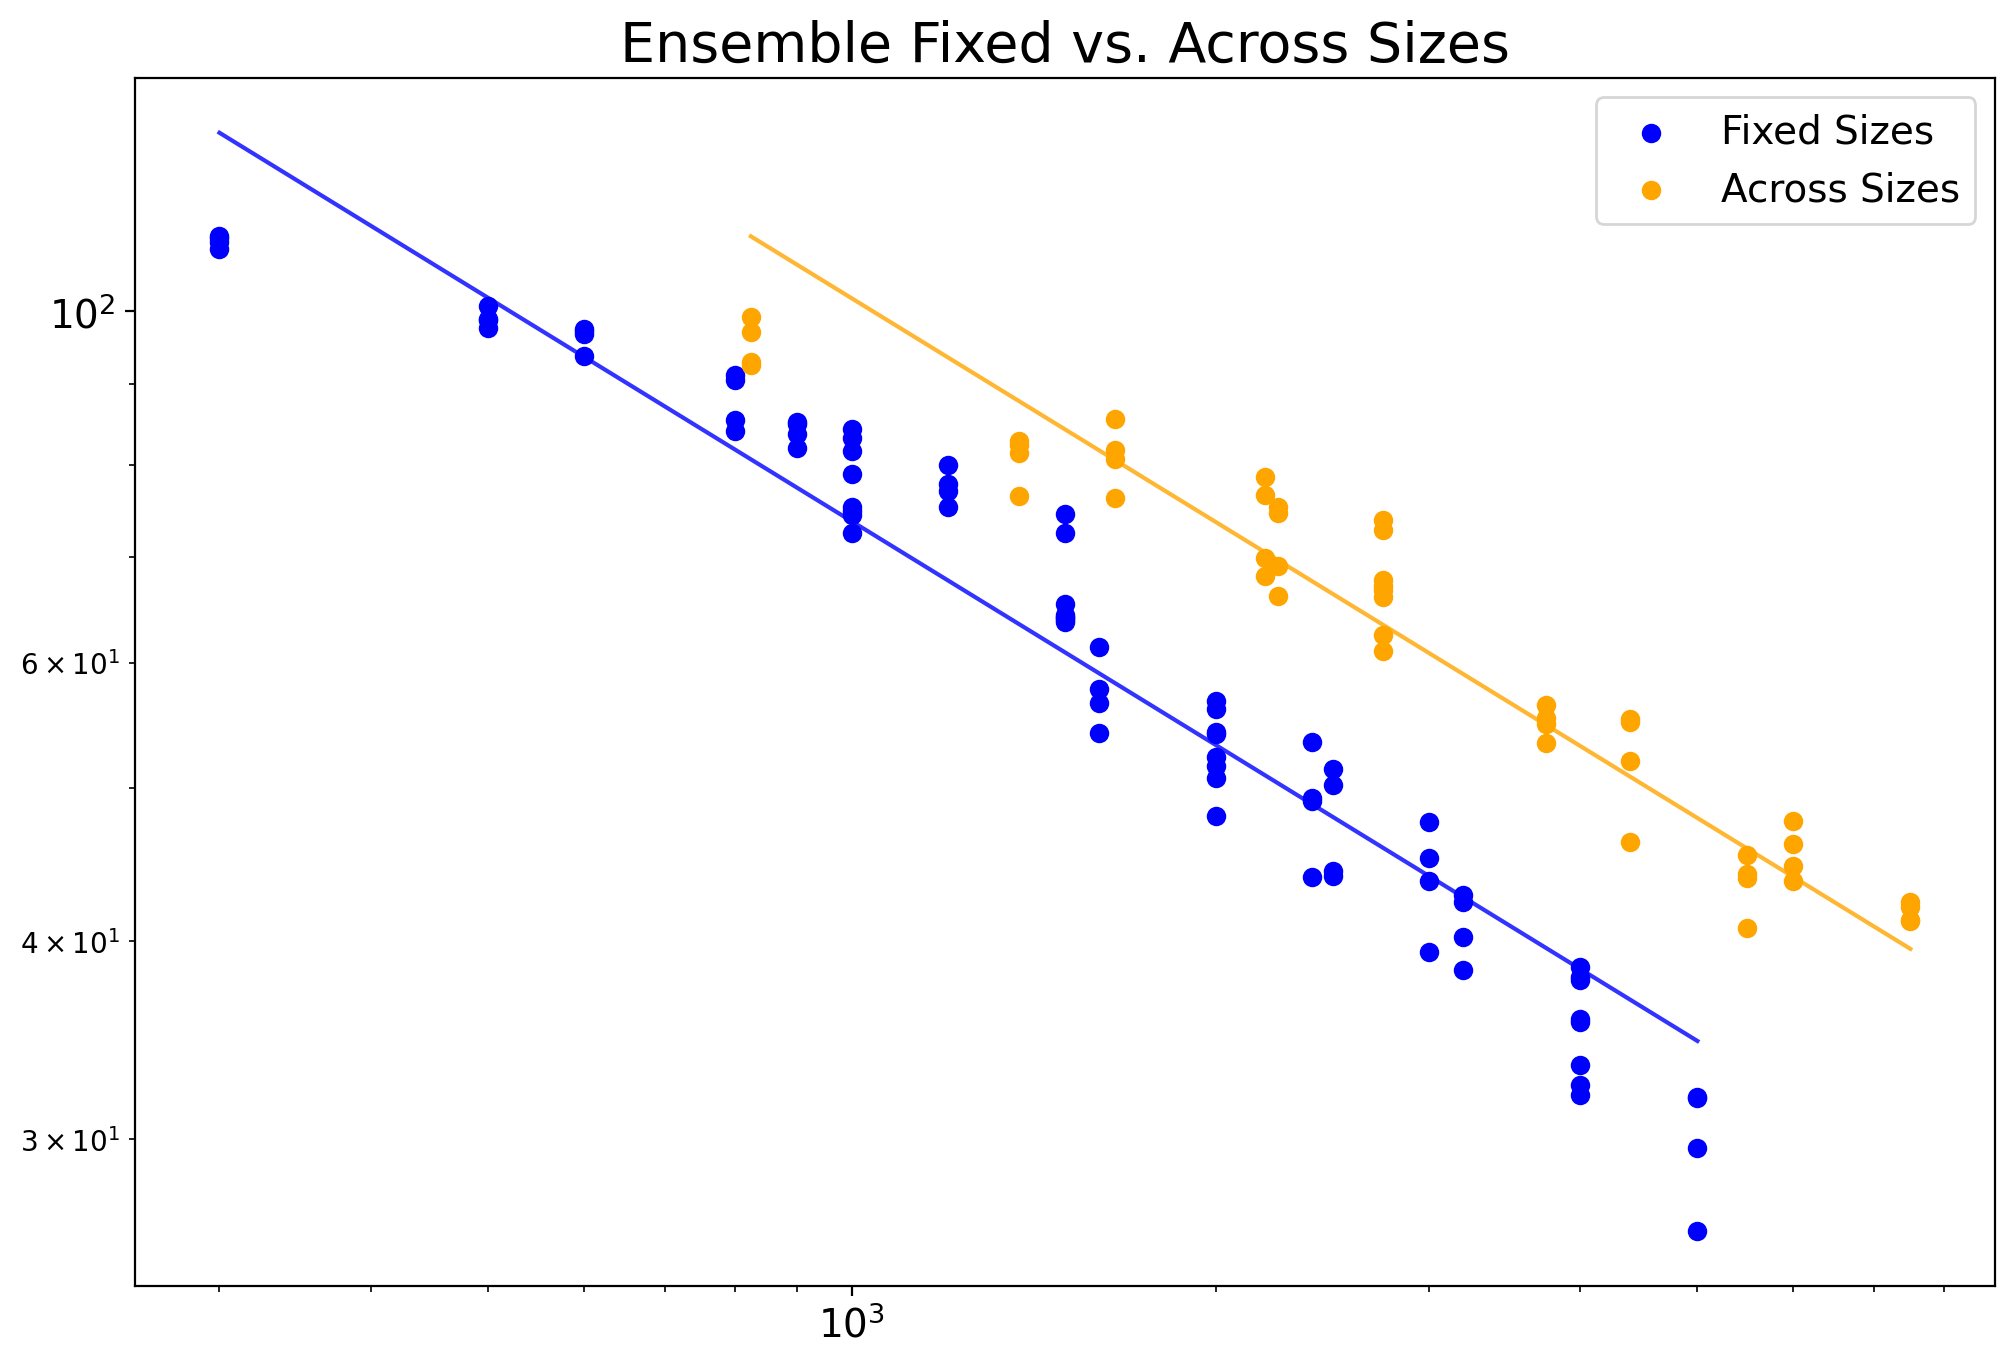
These results seem to suggest that Fixed Sizes work better than across sizes given the same number of unique total regions of interest (noting that Size for ensembles is calculated as the sum of each pooled parcellations Size / unique regions of interest).
We can also check for interactions with Size, but first we will restrict the results to only the overlapping sizes. Then model as log10(Mean_Rank) ~ log10(Size) * C(Across_Sizes)
| Dep. Variable: | Mean_Rank | R-squared: | 0.953 |
|---|---|---|---|
| Model: | OLS | Adj. R-squared: | 0.951 |
| Method: | Least Squares | F-statistic: | 753.0 |
| Date: | Mon, 13 Sep 2021 | Prob (F-statistic): | 4.78e-74 |
| coef | std err | t | P>|t| | [0.025 | 0.975] | |
|---|---|---|---|---|---|---|
| Intercept | 3.6551 | 0.050 | 73.676 | 0.000 | 3.557 | 3.753 |
| C(across_sizes)[T.1] | -0.4509 | 0.074 | -6.100 | 0.000 | -0.597 | -0.304 |
| Size | -0.5839 | 0.015 | -38.705 | 0.000 | -0.614 | -0.554 |
| Size:C(across_sizes)[T.1] | 0.1759 | 0.022 | 8.048 | 0.000 | 0.133 | 0.219 |
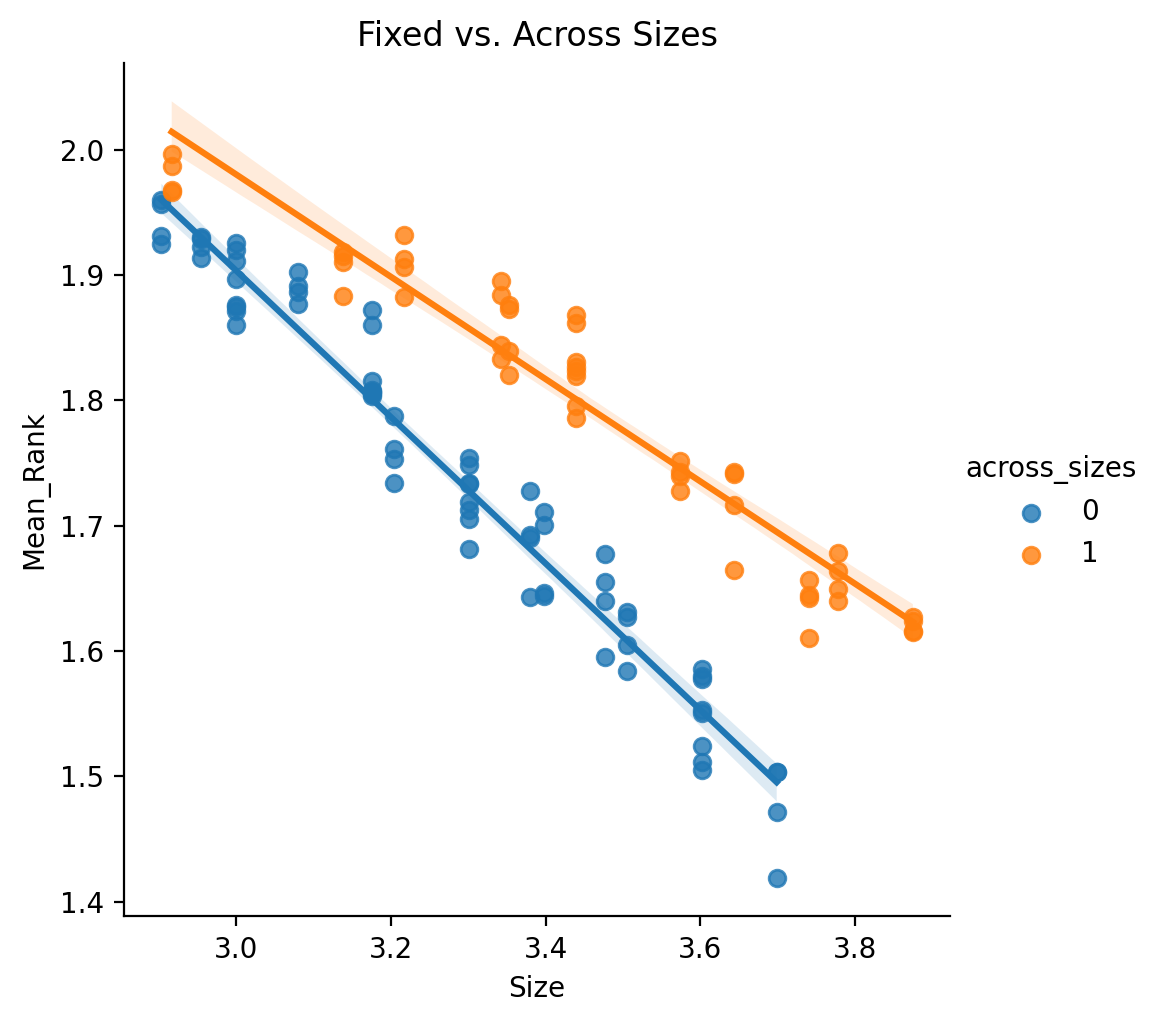
These results indicate that not only do fixed size parcellations do better, but they exhibit different scaling with respect to size. The biggest caveat to all of these comparisons being that the different sizes for fixed sizes and ranges of sizes for across sizes were hardly comprehensive.