Results by Pipeline Median
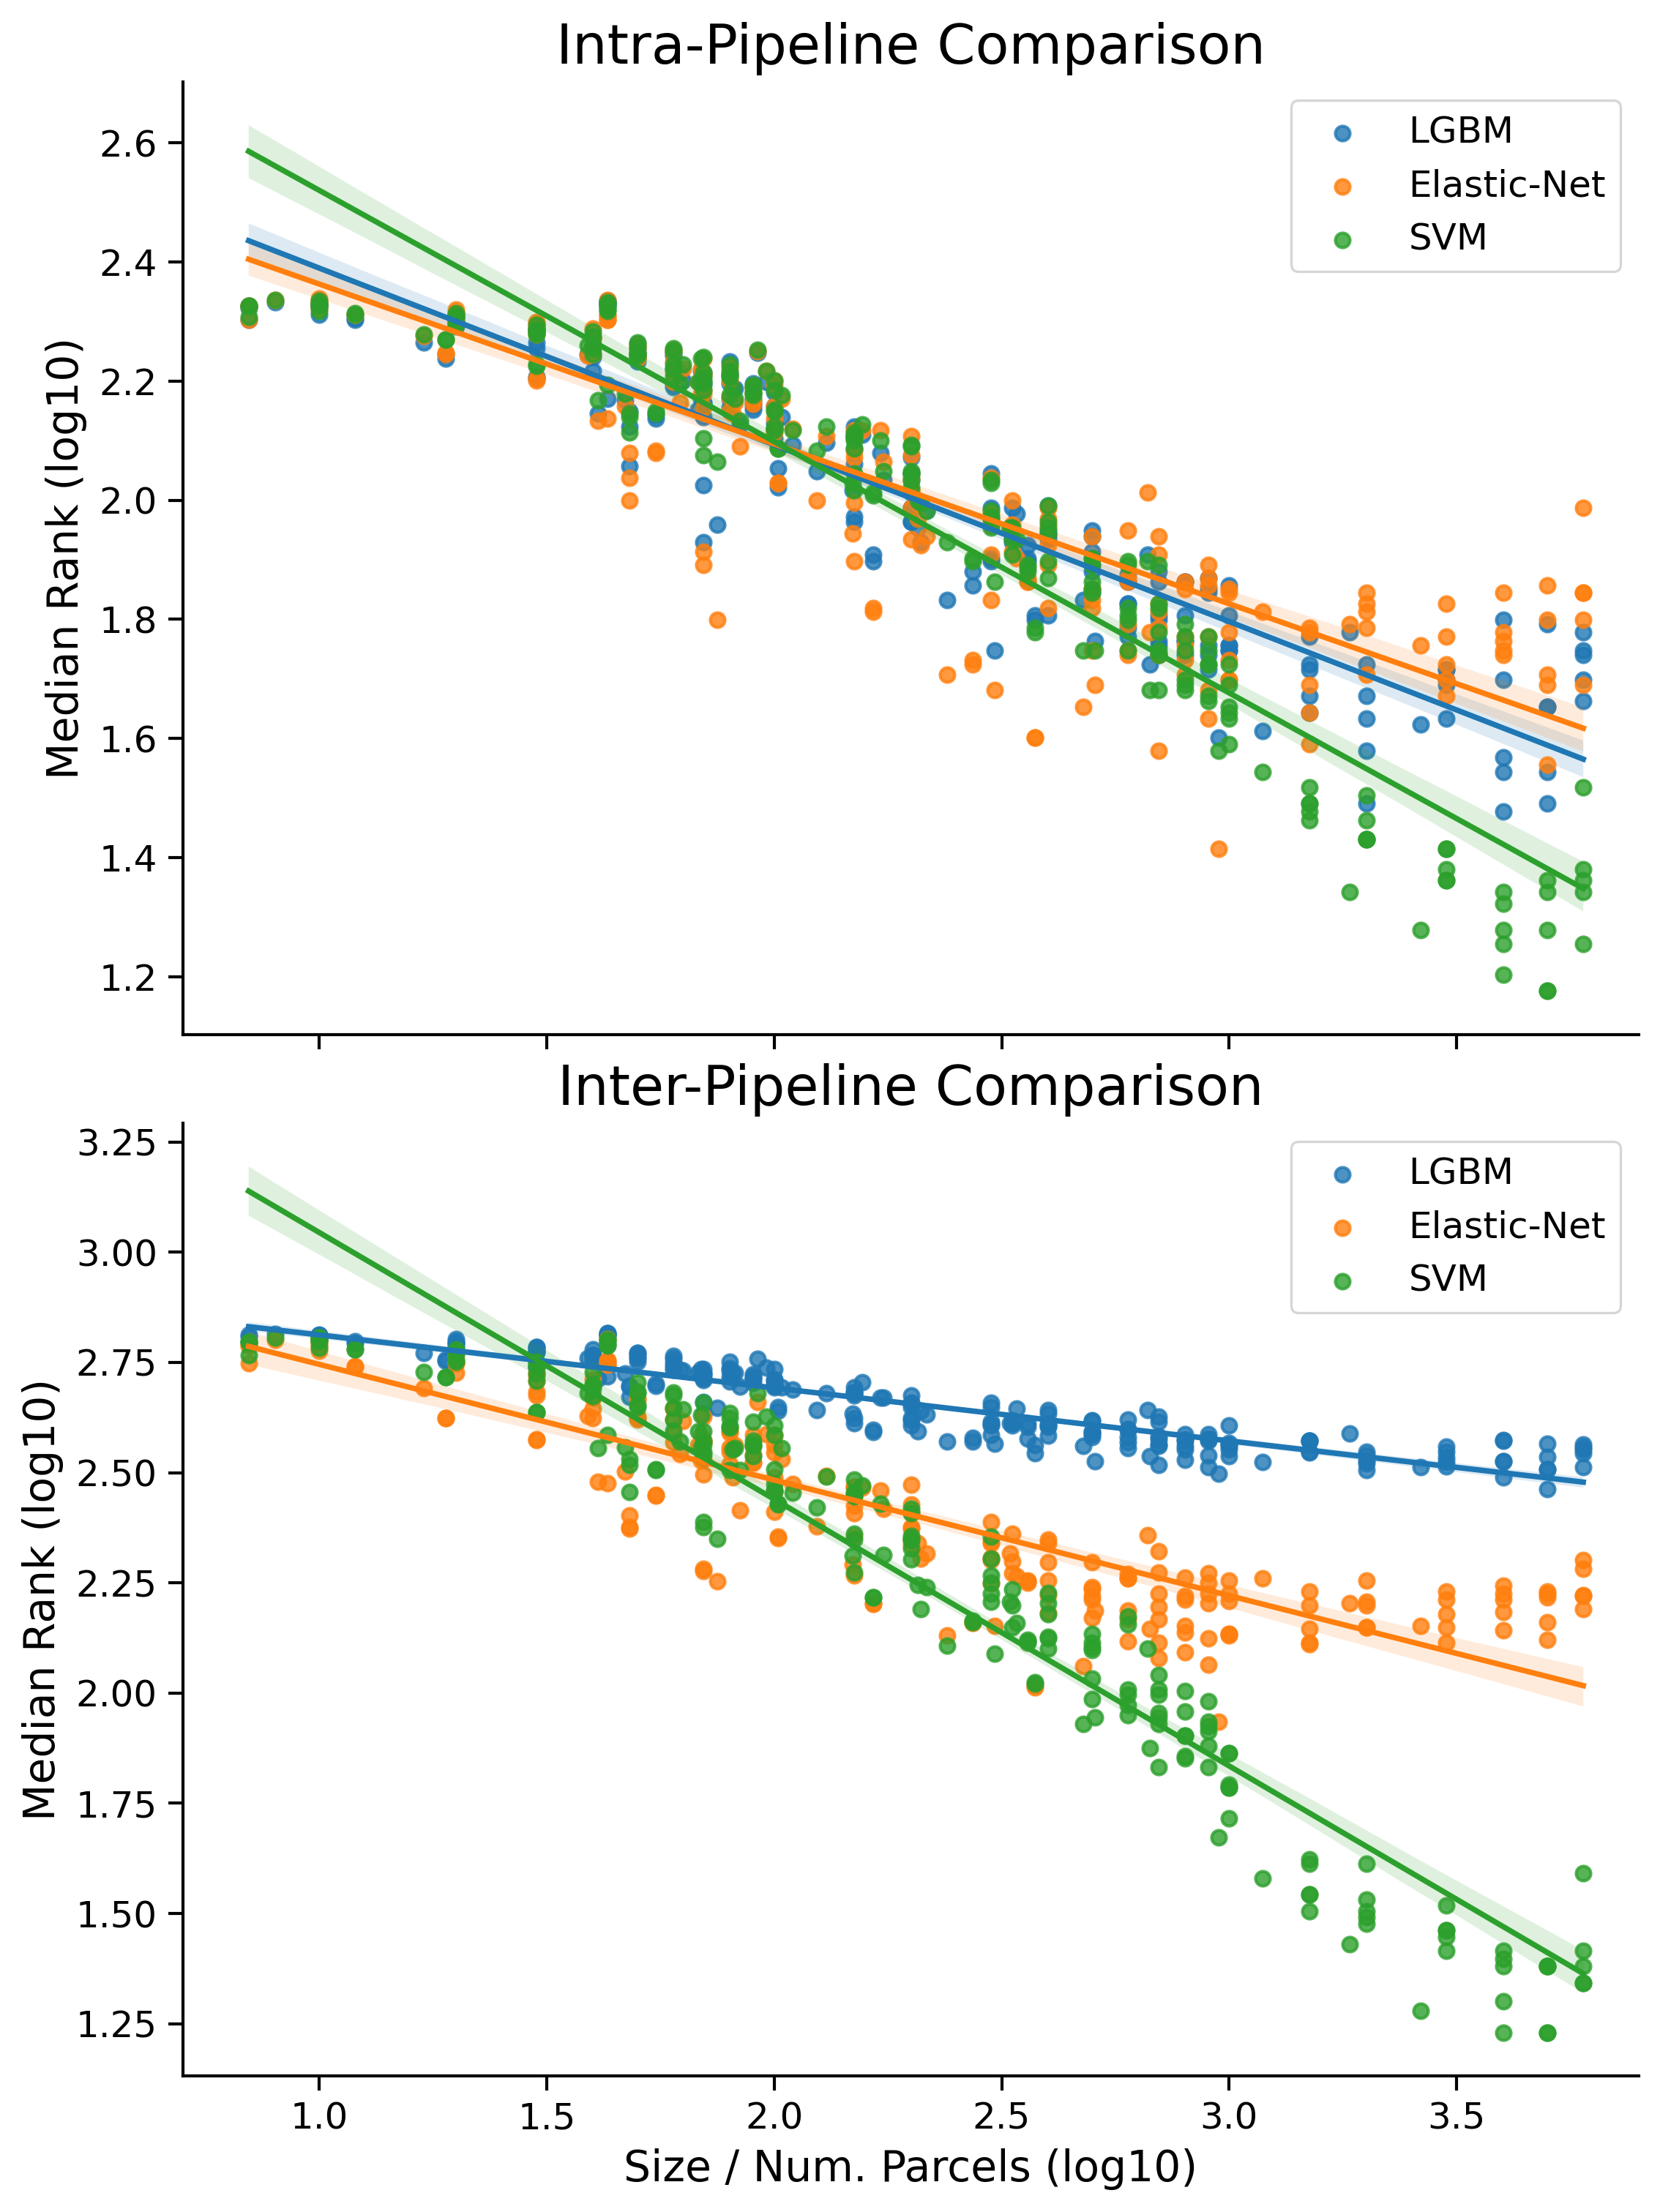
This page goes over again the By Pipeline results, but uses Median Rank from Alternative ranks instead of Mean Rank. As before, we show both an Intra and Inter pipeline (corresponding to the top and bottom of the figure below).
-
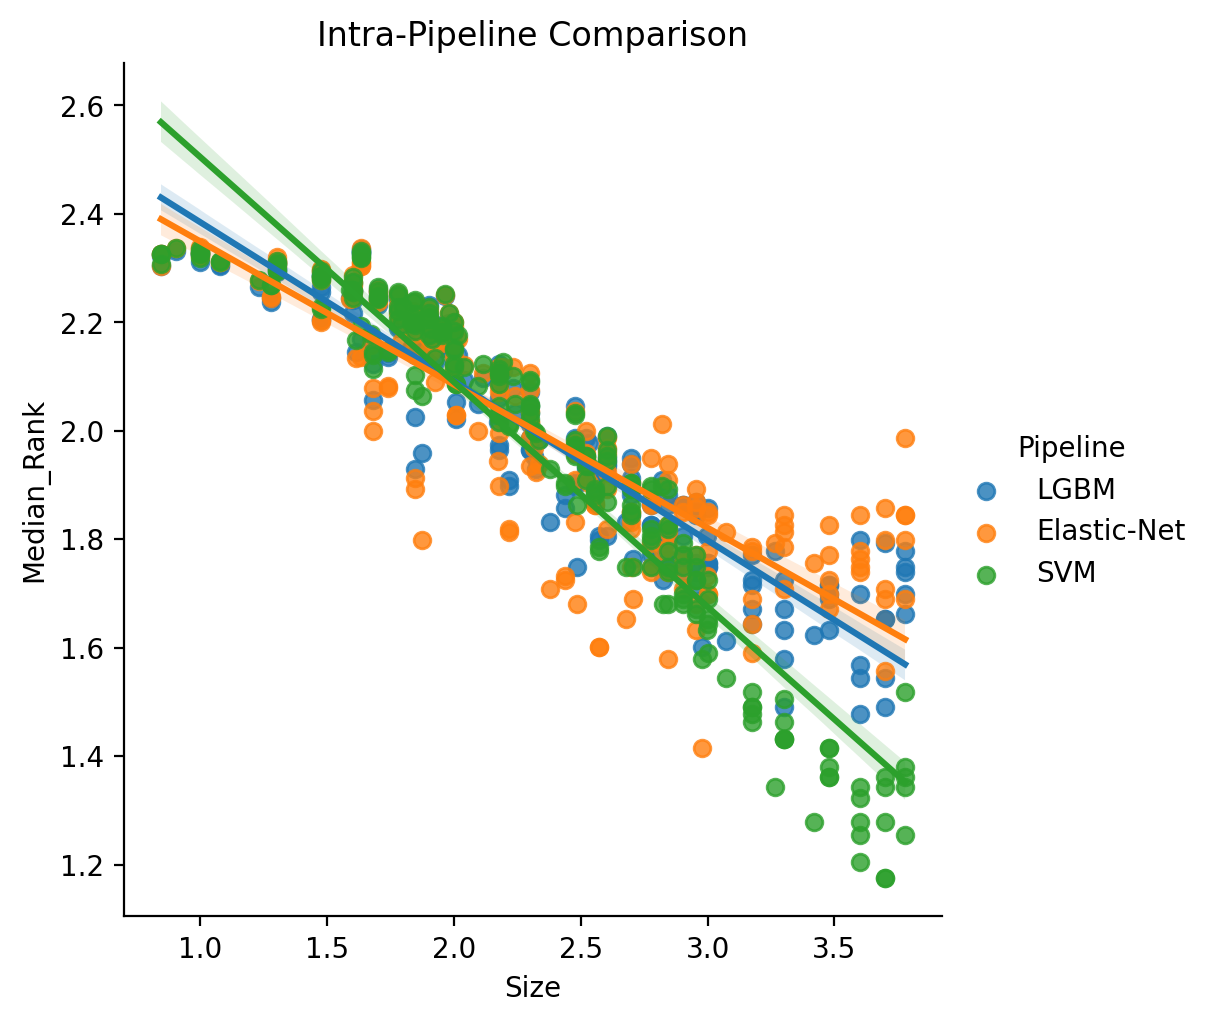
The top part of the figure, Intra-Pipeline Comparison, shows median rank for each pipeline as computed only relative to other parcellations evaluated with the same pipeline
-
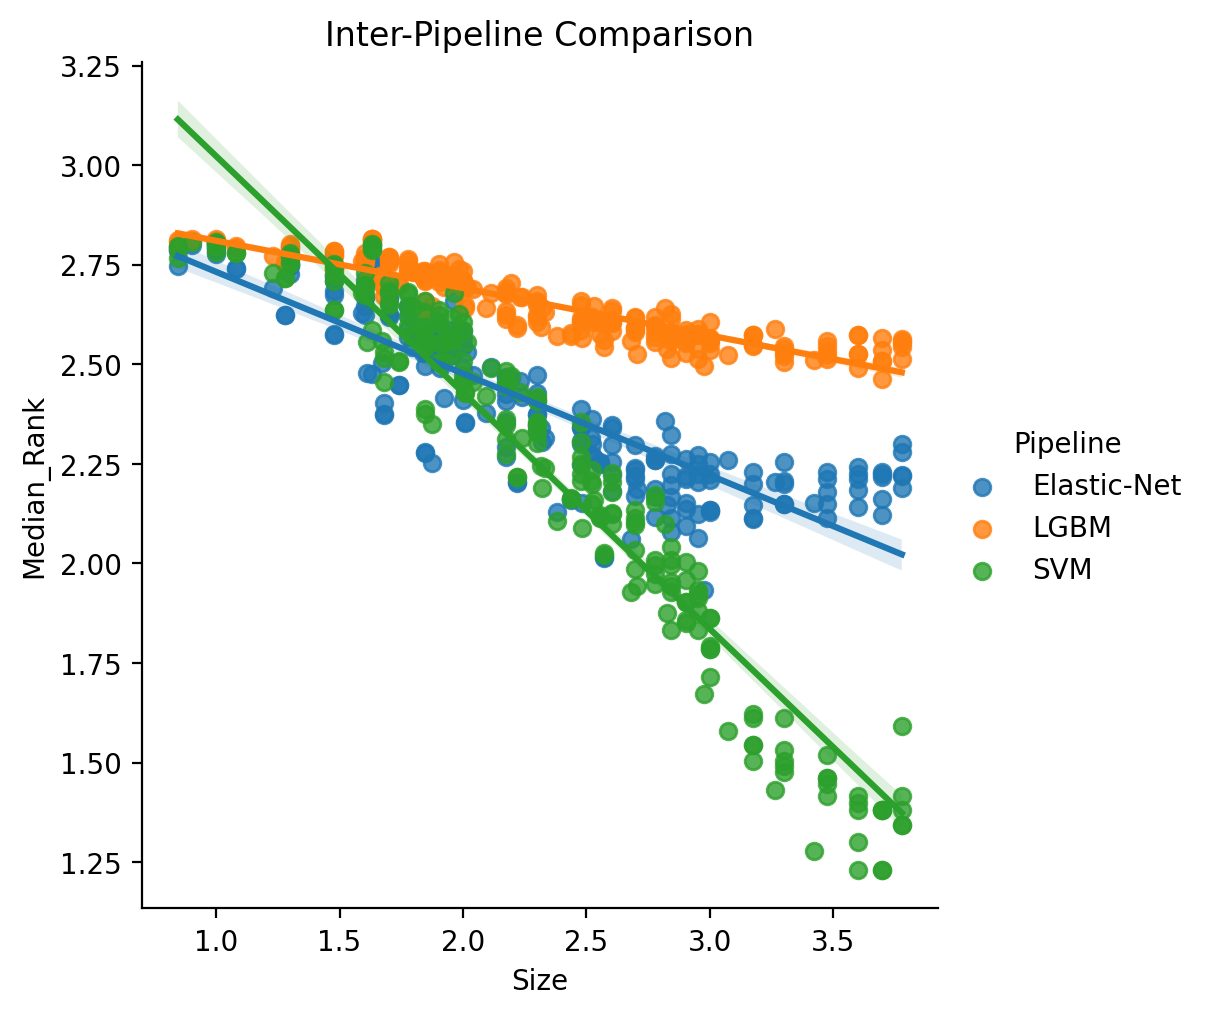
The bottom part of the figure, Inter-Pipeline Comparison, shows median rank as calculated between each parcellation-pipeline combination.
-
The regression line of best fit on the log10-log10 data are plotted separately for each pipeline across both figures (shaded regions around the lines of fit represent the bootstrap estimated 95% CI). The OLS fit here was with robust regression.
Specific statistical tables and results are re-created below.
Intra-Pipeline Comparison
| Dep. Variable: | Median_Rank | R-squared: | 0.864 |
|---|---|---|---|
| Model: | OLS | Adj. R-squared: | 0.863 |
| Method: | Least Squares | F-statistic: | 828.4 |
| Date: | Mon, 03 Jan 2022 | Prob (F-statistic): | 4.05e-280 |
| coef | std err | t | P>|t| | [0.025 | 0.975] | |
|---|---|---|---|---|---|---|
| Intercept | 2.6134 | 0.022 | 120.447 | 0.000 | 2.571 | 2.656 |
| C(Pipeline)[T.LGBM] | 0.0648 | 0.031 | 2.112 | 0.035 | 0.005 | 0.125 |
| C(Pipeline)[T.SVM] | 0.3062 | 0.031 | 9.980 | 0.000 | 0.246 | 0.366 |
| Size | -0.2641 | 0.009 | -29.575 | 0.000 | -0.282 | -0.247 |
| Size:C(Pipeline)[T.LGBM] | -0.0294 | 0.013 | -2.327 | 0.020 | -0.054 | -0.005 |
| Size:C(Pipeline)[T.SVM] | -0.1507 | 0.013 | -11.935 | 0.000 | -0.175 | -0.126 |
Inter-Pipeline Comparison
| Dep. Variable: | Median_Rank | R-squared: | 0.920 |
|---|---|---|---|
| Model: | OLS | Adj. R-squared: | 0.920 |
| Method: | Least Squares | F-statistic: | 1508. |
| Date: | Mon, 03 Jan 2022 | Prob (F-statistic): | 0.00 |
| coef | std err | t | P>|t| | [0.025 | 0.975] | |
|---|---|---|---|---|---|---|
| Intercept | 2.9877 | 0.022 | 137.432 | 0.000 | 2.945 | 3.030 |
| C(Pipeline)[T.LGBM] | -0.0584 | 0.031 | -1.899 | 0.058 | -0.119 | 0.002 |
| C(Pipeline)[T.SVM] | 0.6288 | 0.031 | 20.452 | 0.000 | 0.568 | 0.689 |
| Size | -0.2553 | 0.009 | -28.543 | 0.000 | -0.273 | -0.238 |
| Size:C(Pipeline)[T.LGBM] | 0.1364 | 0.013 | 10.783 | 0.000 | 0.112 | 0.161 |
| Size:C(Pipeline)[T.SVM] | -0.3382 | 0.013 | -26.734 | 0.000 | -0.363 | -0.313 |