Single vs. Ensembled Parcellations
We can model the results from the Multiple Parcellations Experiment
with a focus on teasing apart performance differences between single vs. ensembled parcellations. Specifically we create
a binary flag for any results which were ensembled (in this case treating “Grid” as not ensembled), and
model as: log10(Mean_Rank) ~ log10(Size) * Is_Ensemble.
| Dep. Variable: | Mean_Rank | R-squared: | 0.959 |
|---|---|---|---|
| Model: | OLS | Adj. R-squared: | 0.959 |
| Method: | Least Squares | F-statistic: | 3211. |
| Date: | Mon, 13 Sep 2021 | Prob (F-statistic): | 2.50e-283 |
| coef | std err | t | P>|t| | [0.025 | 0.975] | |
|---|---|---|---|---|---|---|
| Intercept | 2.7859 | 0.011 | 248.940 | 0.000 | 2.764 | 2.808 |
| C(Is_Ensemble)[T.1] | 0.6148 | 0.046 | 13.348 | 0.000 | 0.524 | 0.705 |
| Size | -0.1635 | 0.005 | -36.167 | 0.000 | -0.172 | -0.155 |
| Size:C(Is_Ensemble)[T.1] | -0.2809 | 0.014 | -19.696 | 0.000 | -0.309 | -0.253 |
The difference is even more obvious when explicitly plotted.
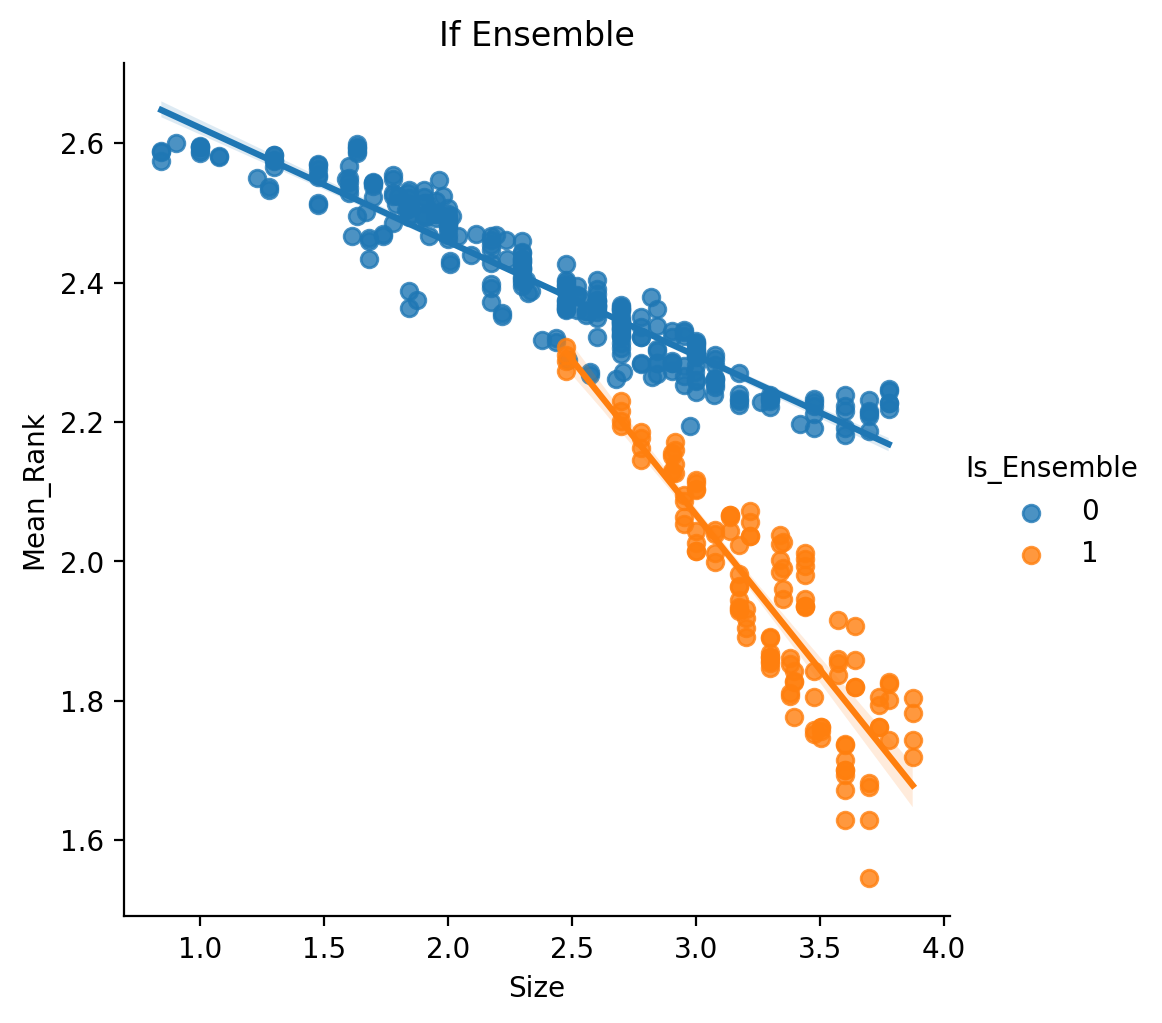
The take-away here is that there is a clear benefit in employing ensembles across multiple parcellations especially relative to using the information from a single parcellation. This benefit importantly takes into account that most of the tested ensemble methods have more unique parcels than their single parcellation counterparts. The other point of interest is that these ensembles were all generated using random parcellations, which previous results showed to be much worse than existing parcellations - which serves to highlight even further the benefit from ensembling.
-
See Full Results Table for a sortable table with specific results.
-
See All Interactive By Target for an interactive plot breaking down results by target.