BPt.Dataset.plot#
- Dataset.plot(scope, subjects='all', cut=0, decode_values=True, count=True, show=True, reduce_func=<function mean>, n_jobs=-1, axes=None, ax=None)[source]#
This function creates plots for each of the passed columns (as specified by scope) seperately.
- Parameters
- scopeScope
A BPt style Scope used to select a subset of column(s) in which to apply the current function to. See Scope for more information on how this can be applied.
- subjectsSubjects
This argument can be any of the BPt accepted subject style inputs. E.g., None, ‘nan’ for subjects with any nan data, or ‘not not’ for subjects without any, the str location of a file formatted with one subject per line, or directly as an array-like of subjects, to list a few options.
See Subjects for all options, and a more detailed description of the already mentioned options.
- decode_valuesbool, optional
When handling categorical variables that have been encoded through a BPt dataset method, e.g.,
Dataset.ordinalize(), then you may optionally either use either the original categorical values before encoding with decode_values = True, or use the current internal values with decode_values = False.default = True
- cutfloat, optional
Only for plotting non-categorical variables. Factor, multiplied by the smoothing bandwidth, that determines how far the evaluation grid extends past the extreme datapoints. When set to 0, truncate the curve at the data limits.
default = 0
- countbool, optional
Only for plotting categorical variables. If True, then display the counts, if False, then display the frequency out of 1.
default = True
- showbool or ‘default’, optional
If plt.show() from matplotlib should be called after plotting each column within the passed scope. You will typically want this parameter to be the default True, as when plotting multiple columns, they might otherwise overlap.
In the case that you are only plotting one column, and want to make customizations, then you should pass this value as False, and you can make changes to the figure via matplotlib’s global state system.
Note: If axes or ax is passed as non-null, then default swaps to False. Otherwise default is True.
default = 'default'
- reduce_funcpython function, optional
The passed python function will be applied only if the requested col/column is a ‘data file’. In the case that it is, the function should accept as input the data from one data file, and should return a single scalar value. For example, the default value is numpy’s mean function, which returns one value.
default = np.mean
- n_jobsint, optional
As with reduce_func, this parameter is only valid when the passed col/column is a ‘data file’. In that case, this specifies the number of cores to use in loading and applying the reduce_func to each data file. This can provide a significant speed up when passed the number of available cores, but can sometimes be memory intensive depending on the underlying size of the file.
If set to -1, will try to automatically use all available cores.
default = -1
- axeslist of Axes or None, optional
Can optionally pass a list of axes in which to add each plot to. By default plot each seperate
default = None
- axAxes or None, optional
Simmilar to axes, but in the case of only plotting a single column, this parameter can also be used.
default = None
Examples
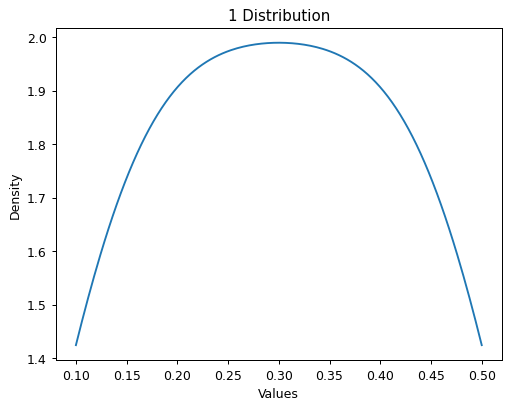
This example shows plotting a float feature.
data = bp.Dataset()
data['1'] = [.1, .1, .2, .2, .3, .3, .4, .4, .5, .5]
data.plot(scope='1')